
Figures & data
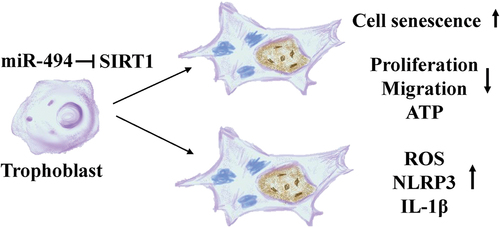
Table 1. The demographics and clinical characteristicsa of patients in our study.
Table 2. Primer sequences.
Figure 1. SAβG and SIRT1 expression in normal (n = 20) and SPE (n = 20) placentas (×200). a. SAβG staining of human placenta sections. SAβG-positive cells in syncytiotrophoblasts and cytotrophoblasts (arrowheads) were increased in SPE placentas (p < 0.001). Scale bars, 50 µm. b. immunohistochemistry was used to measure SIRT1 protein expression in placental sections. SIRT1 was present in the syncytiotrophoblast and cytotrophoblast (arrowheads), but SIRT1 expression was lower in SPE placentas (p < 0.01). Scale bars, 50 µm. The data are presented as the mean ± SD, **p < 0.01, ***p < 0.001.
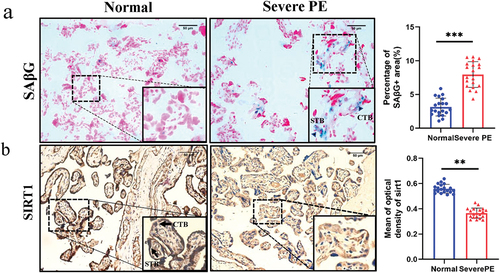
Figure 2. SIRT1 is a direct target of miR-494 in HTR-8/SVneo cells. a. Prediction of miRnas that bind to SIRT1 (TargetScan top 50, miRDB, and GSE15789). b. RT‑qPCR analysis of miR-601, miR-138, miR-212, miR-29a, and miR-494 expression in placenta. c. The predicted binding sites of miR-494 in the 3’-UTR of SIRT1. d. Luciferase reporter assays. e. miR-494 expression after mimic transfection for 48 h. f. SIRT1 mRNA expression 48 h after miR-494 mimic transfection. g. SIRT1 protein expression after miR-494 mimic transfection for 48 h. h. Immunofluorescence staining of SIRT1 (green) after miR-494 mimic transfection for 48 h. Nuclei were stained with DAPI (blue). SIRT1 was present in the HTR-8/SVneo nucleus (×200). Scale bars, 200 µm. The data are presented as the mean ± SD from three independent experiments, and every experiment was repeated three times, *p < 0.05, **p < 0.01, ***p < 0.001.
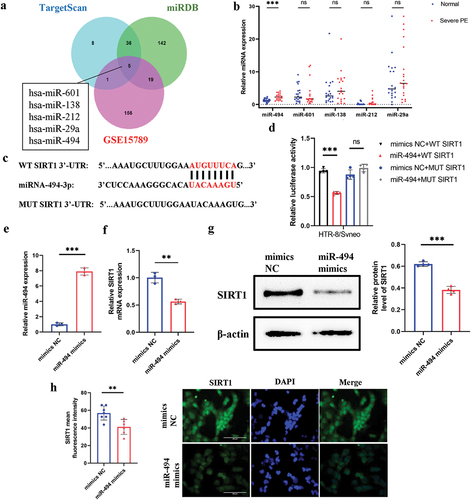
Figure 3. MiR-494 induces a senescent phenotype in HTR-8/SVneo cells a. miR-494 mimics increased the activity of SAβG (×200). Scale bars, 50 µm. b. miR-494 mimics inhibited G0/G1 to S phase progression in the cell cycle in HTR-8/SVneo cells. c. miR-494 mimics inhibited HTR-8/SVneo proliferation, as shown by CCK-8 assays. d. miR-494 mimics upregulated HTR-8/SVneo P21 and P16 protein levels, as shown by WB. The data are presented as the mean ± SD from three independent experiments, and every experiment was repeated three times, *p < 0.05, **p < 0.01, ***p < 0.001.
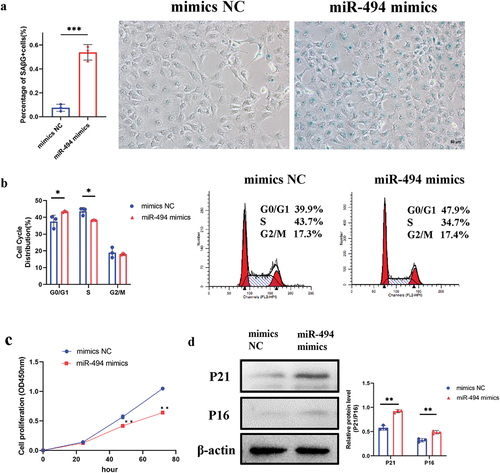
Figure 4. MiR-494 decreased the viability and increased the ROS and inflammatory molecule production of HTR-8/SVneo cells a. miR-494 mimics inhibited HTR-8/SVneo cell migration (×100). Scale bars, 100 µm. b. miR-494 mimics increased HTR-8/SVneo cell ROS levels (×200). Scale bars, 200 µm. c. miR-494 mimics decreased HTR-8/SVneo cell ATP levels. d. miR-494 mimics increased HTR-8/SVneo NLRP3 and IL-1β protein levels, as shown by WB. The data are presented as the mean ± SD from three independent experiments, and every experiment was repeated three times, *p < 0.05, **p < 0.01, ***p < 0.001.
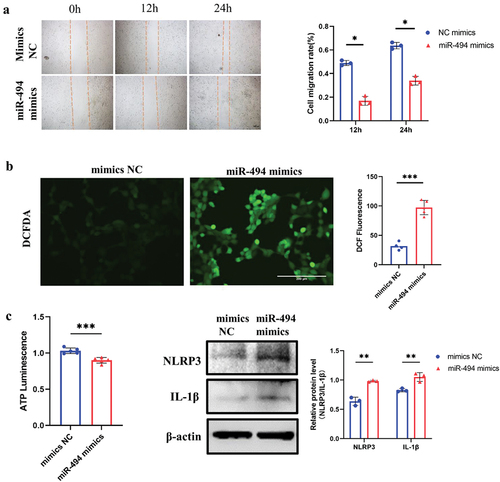
Figure 5. SIRT1 plasmids partially rescued HTR-8/SVneo cell senescence induced by miR-494 mimics a. Western blotting was used to measure SIRT1 protein expression in HTR-8/SVneo cells after miR-494 and SIRT1 expression regulation. b. SIRT1 plasmids partially reduced HTR-8/SVneo cell proliferation, as shown by CCK-8 assays. c. SIRT1 plasmids partially rescued the G0/G1-to-S-phase progression of the cell cycle in HTR-8/SVneo cells. d. SIRT1 plasmids partially weakened the activity of SaβG (×200). Scale bars, 50 µm. e. SIRT1 plasmids partially decreased the protein levels of P21 and P16, as shown by WB. The data are presented as the mean ± SD from three independent experiments, and every experiment was repeated three times, *p < 0.05, **p < 0.01, ***p < 0.001.
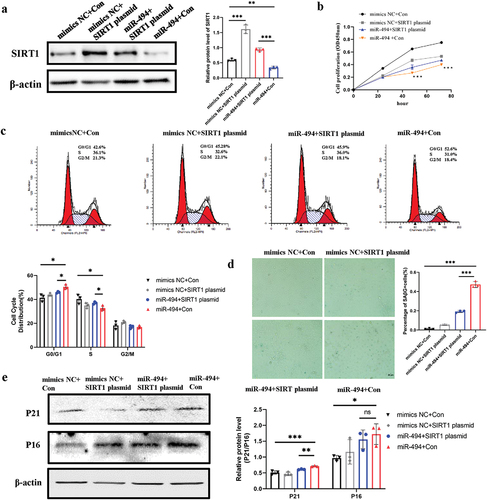
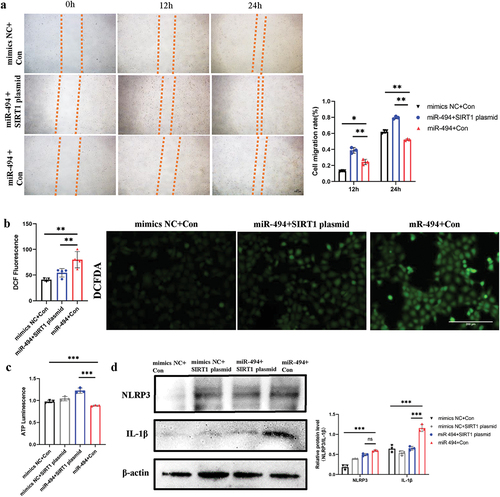
Figure 6. SIRT1 plasmids rescued HTR-8/SVneo cell viability and partially decreased ROS and inflammatory molecule production a. SIRT1 plasmids reduced HTR-8/SVneo cell migration (×100). Scale bars, 100 µm. b. SIRT1 plasmids partially weakened miR-494 mimic-induced ROS production in HTR-8/SVneo cells (×200). Scale bars, 200 µm. c. SIRT1 plasmids reduced ATP levels in HTR-8/SVneo cells induced by miR-494 mimics. d. SIRT1 plasmids downregulated NLRP3 and IL-1β protein levels in HTR-8/SVneo cells, as shown by WB. The data are presented as the mean ± SD from three independent experiments, and every experiment was repeated three times, *p < 0.05, **p < 0.01, ***p < 0.001.
Data availability statement
The data underlying this article are available in Figshare at https://doi.org/10.6084/m9.figshare.22816079