
Figures & data
Figure 1. USCOM graphic user interface of the velocity-time signal of a patient’s blood exiting the aortic valve, with superimposed FlowTrace (in red).
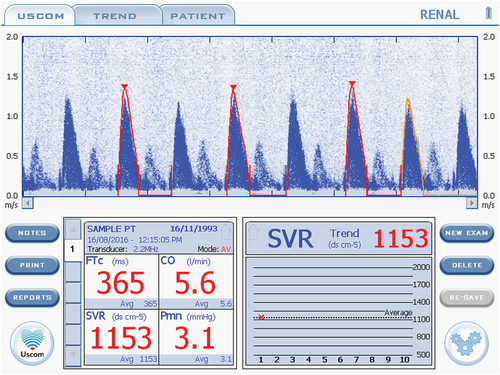
Table 1. Recruitment demographic and hemodynamic data of initial groups in mean and standard deviation, compared with ANOVA testing. Statistically significant results are shown in red. Significant results of pair-wise comparisons shown using in-cell symbols.
Table 2. Recruitment demographic and hemodynamic data of final groups with one-way ANOVA testing, in mean and standard deviation. Statistically significant results are shown in red. Significant results of pair-wise comparisons shown using in-cell symbols.
Table 3. Haemodynamic indices in hypertensive pregnant women who did and did not progress to PE, compared using ANOVA.
Table 4. Haemodynamic parameters in women initially diagnosed with CH or GH with subsequent progression to PE, compared using ANOVA testing.
Table 5. Haemodynamic parameters of women initially diagnosed with PE with or without subsequent development to severe PE, compared using students’ t-tests.
Table 6. Haemodynamic parameters among untreated participants who did and did not progress to PE, compared using ANOVA testing.
Data availability statement
The data collected for this study can be accessed by directly contacting the corresponding author.