
Figures & data
Table 1. Comparison between the general characteristics, routine blood test indicators, and traditional coagulation indicators of the two groups.
Figure 1. Comparison of baseline levels of ACT, CR and PF between the two groups.
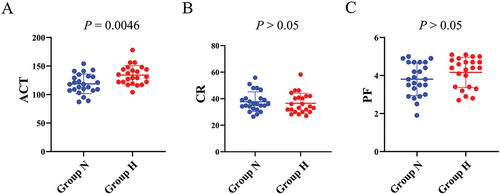
Figure 2. Comparison of ACT, CR and PF between the two groups in the hemodilution assay.
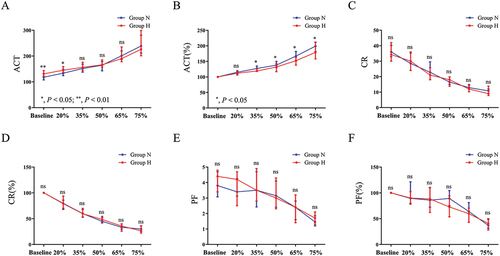
Table 2. Cross-sectional comparison of the normalized values of ACT, CR, and PF in the two groups at different dilution concentrations.
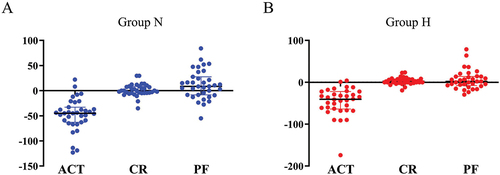
Figure 3. Changes comparison of ACT, CR and PF between the two groups.
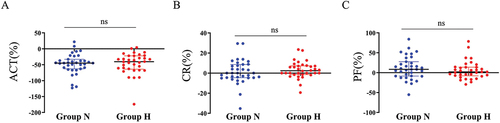
Figure 4. Cross-sectional comparison of the normalized values of ACT, CR and PF in the two groups after blood resupplementation.
Data availability statement
The datasets used during the current study are available from the corresponding authors on reasonable requests.