Figures & data
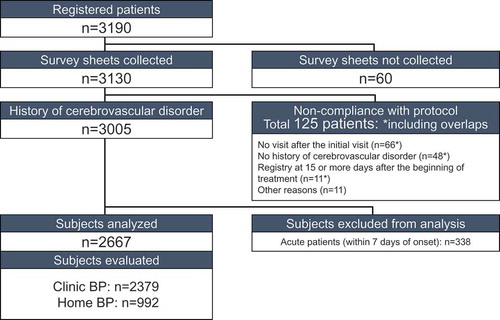
Table 1. Patient characteristics.
Figure 2. Time-course of changes in blood pressure and pulse rate. Abbreviations: BP, blood pressure; M, month or months; SBP, systolic blood pressure; DBP, diastolic blood pressure; PR, pulse rate. Data are presented as mean ± SD. *P < 0.05 vs. baseline (0M).
![Figure 2. Time-course of changes in blood pressure and pulse rate. Abbreviations: BP, blood pressure; M, month or months; SBP, systolic blood pressure; DBP, diastolic blood pressure; PR, pulse rate. Data are presented as mean ± SD. *P < 0.05 vs. baseline (0M).](/cms/asset/b5f40bf1-cd4f-46f2-a831-71a6239dc6dd/iceh_a_1235183_f0002_b.gif)
Figure 3. Changes in the proportion of patients categorized by clinic blood pressure and morning home blood pressure at baseline (0M), and after 4 months and 12 months. Abbreviations: SBP, systolic blood pressure; M, month or months; *P-values are for differences between two groups.
![Figure 3. Changes in the proportion of patients categorized by clinic blood pressure and morning home blood pressure at baseline (0M), and after 4 months and 12 months. Abbreviations: SBP, systolic blood pressure; M, month or months; *P-values are for differences between two groups.](/cms/asset/3b1b3ac9-bd21-4320-a2d7-014719264031/iceh_a_1235183_f0003_b.gif)
Figure 4. Difference in the time-course of clinic blood pressure by the clinical subtype of stroke. Abbreviations: BP, blood pressure; M, month or months; SBP, systolic blood pressure; DBP, diastolic blood pressure. Data are presented as mean ±SD. *P < 0.05 vs. baseline (0M).
![Figure 4. Difference in the time-course of clinic blood pressure by the clinical subtype of stroke. Abbreviations: BP, blood pressure; M, month or months; SBP, systolic blood pressure; DBP, diastolic blood pressure. Data are presented as mean ±SD. *P < 0.05 vs. baseline (0M).](/cms/asset/5f299616-25ff-4ed6-8c05-f66ac655b4c9/iceh_a_1235183_f0004_b.gif)
Table 2. Blood pressure control status.