
Figures & data
Table 1. Comparison of clinical parameters between severe preeclampsia patients and normal controls
Figure 1. The expression of UII in placenta tissues. (a). UII mRNA levels in healthy pregnancies and SPE. (b). UII protein expression in healthy pregnancies and SPE. (c). Expression of UII in placenta tissues measured by immunochemistry. Expression of UII in SPE was significantly greater than that in healthy pregnancies and was mainly located in trophoblastic cells (black arrow). Area% was substantially greater in SPE (n = 20 in the control and n = 28 in the SPE) (d). Immunofluorimetry was used to detect the expression of UII. (*P < .05, **P < .01, ****P < .0001 vs. Healthy pregnancy)
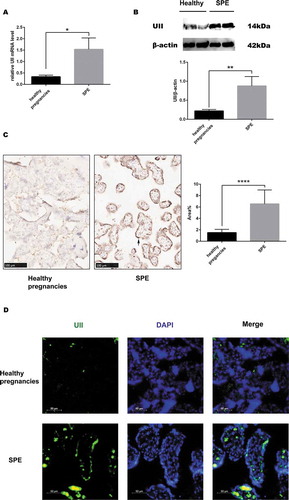
Figure 2. Comparison of the expression of pyroptosis mRNA between SPE and healthy pregnancies analyzed by real-time PCR. (a). caspase-1. (b). NLRP3. (c). IL-1β. (d). GSDMD. (e). Caspase-4. (f). Caspase-5. (*P < .05, **P < .01, ***P < .001 vs. Healthy pregnancy)
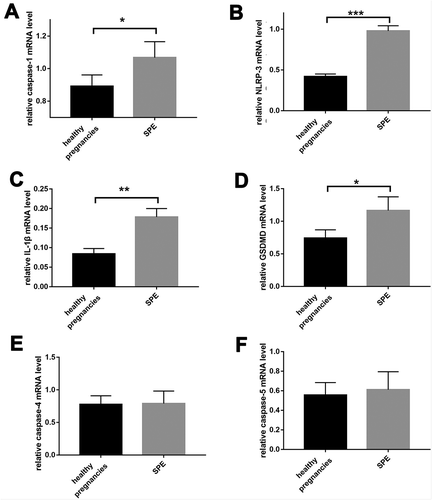
Figure 3. Comparison of the expression of pyroptosis protein between SPE and healthy pregnancies analyzed by western blot. (a). The expression of proteins by western blot. (b). Caspase-4. (c). GSDMD. (d). Caspase-1. (e). NLRP-3. (f). Caspase-5. (g). IL-1β. (***P < .001, ****P < .0001 vs. Healthy pregnancy)
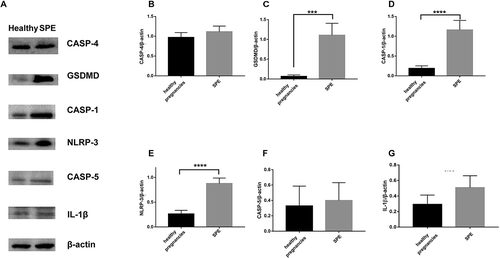
Figure 4. Comparison of the expression of pyroptosis protein between SPE and healthy pregnancies analyzed by immunochemistry (IHC). NLRP-3, caspase-5, caspase-1, caspase-4, GSDMD and IL-1β all were mainly located in trophoblastic cells.(***P < .001, ****P < .0001 vs. Healthy pregnancy)
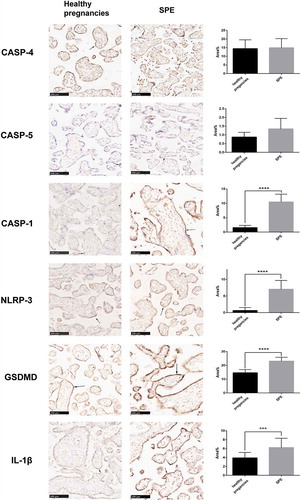
Figure 5. The expression of pyroptosis markers in placenta tissues measured by immunofluorimetry. NLRP-3, caspase-1/4/5 and their downstream signal protein IL-1β were the same location with GSDMD
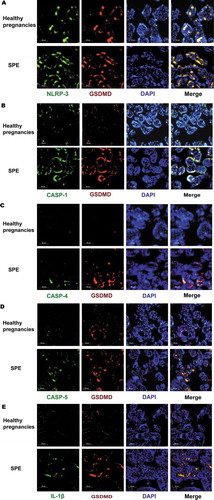
Figure 6. Dead cells detected using TUNEL in placenta tissues. (a). Dead cells detected by TUNEL methods in placenta tissues. Dead cells were green, the nucleus was blue. (b). Analysis of TUNEL positive cells in placentas. There were more dead cell in SPE group in comparison to health pregnancies by TUNEL method. (***P < .001 vs. Healthy pregnancy)
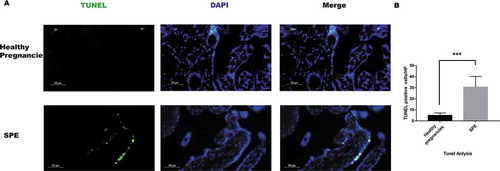
Table 2. The correlation of UII protein expression and pyroptosis markers protein for immunochemistry in the placenta of SPE patients and their relationships with other parameters by Pearson or Spearman correlation analysis
Table 3. The correlation of UII mRNA expression and pyroptosis markers mRNA for real-time PCR in the placenta of SPE patients and their relationships with other parameters