Figures & data
Figure 1. Study protocol. The diagram illustrates the grouping of experimental animals.
Figure 2. SuHx successfully induces PH model and downregulates miRNA153 expression in pulmonary artery tissue. (a) RVSP was measured by right-sided heart catheterization with a pressure transducer microcatheter. (b) RV was dissected from the left ventricle and septum then weighted RV/(LV+S) ratio of each group. (c) The medial thickness percentage (MT%) of rat pulmonary arteries in normal and SuHx groups. (d) Representative images of hematoxylin-eosin (h&e) staining (70–100 μm, 400× magnification). (e, g) Western blot analysis of NFATc3 total protein and nucleoprotein in pulmonary artery tissues. (f, h) RT-qPCR analysis of miRNA153 and NFATc3 expression in the pulmonary artery tissue. N = 10 for each group. Comparisons were performed using one-way ANOVA followed by Bonferroni’s post hoc test. *P < .05, **P < .01 vs normal group (n); #P < .05, ##P < .01 vs SuHx-3 w group. The results are expressed as the mean ± SEM. SuHx, SU5416 combined with hypoxia; PH, pulmonary hypertension; miRNA153, microRNA153; RVSP, right ventricular systolic pressure; RV, right ventricle; LV, left ventricle; S, septum; H&E, hematoxylin and eosin RT-qPCR, quantitative real-time polymerase chain reaction; SEM, standard error of mean.
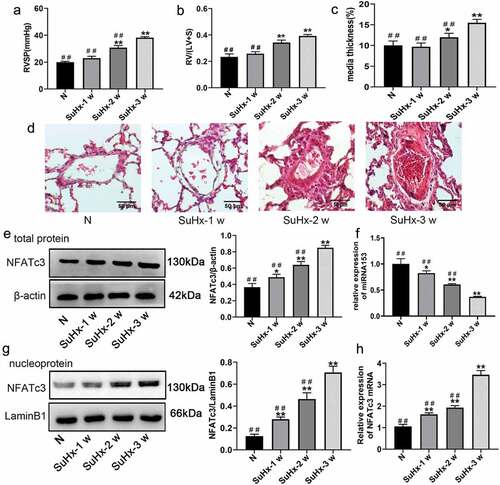
Figure 3. MiRNA153 alleviates SuHx-induced PH and right ventricular function in rats. (a) RV systolic pressure traces. (b) RVSP was measured by right-sided heart catheterization with a pressure transducer microcatheter. (c) RV/(LV+S) ratio. (d)The media wall thickness of small pulmonary artery. (e)Representative images of H&E staining of lung sections (70–100 μm, 400× magnification). N = 10 for each group, *P < .05, **P < .01 vs control group; #P < .05, ##P < .01 vs miR-NC group. The results are expressed as the mean ± SEM. miRNA153, microRNA153; SuHx, SU5416 combined with hypoxia; PH, pulmonary hypertension; RVSP, right ventricular systolic pressure; RV, right ventricle; LV, left ventricle; S, septum; H&E, hematoxylin and eosin SEM, standard error of mean.
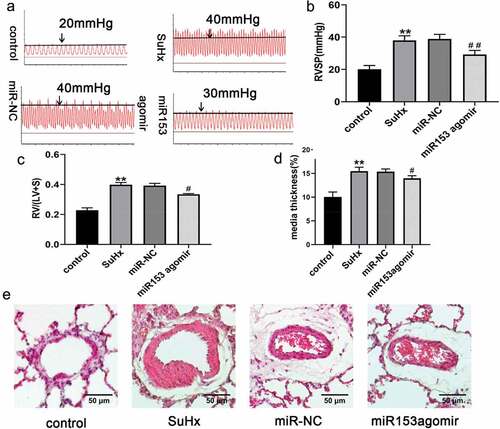
Figure 4. Effect of miRNA153 on NFATc3 in SuHx-induced PH. (a, b) RT-qPCR analysis of mRNA153 and NFATc3 mRNA expression in the pulmonary artery tissues of rats after treatment of miR153agomir. (c, d, e) The protein levels of NFATc3 and Kv1.5 in pulmonary artery tissue of rats were detected by western blot assay. (F)The expression of NFATc3 in pulmonary artery tissue was assessed by immunofluorescence staining (100× magnification). N = 10 per group *P < .05, **P < .01 vs control group; #P < .05, ##P < .01 vs miR-NC group. All data are mean ± SEM. miRNA153, microRNA153; NFATc3, nuclear factor of activated T cell isoform c3; SuHx, SU5416 combined with hypoxia; PH, pulmonary hypertension; RT-qPCR, quantitative real-time polymerase chain reaction; Kv1.5, potassium voltage-gated channel subfamily A member 5; SEM, standard error of mean.
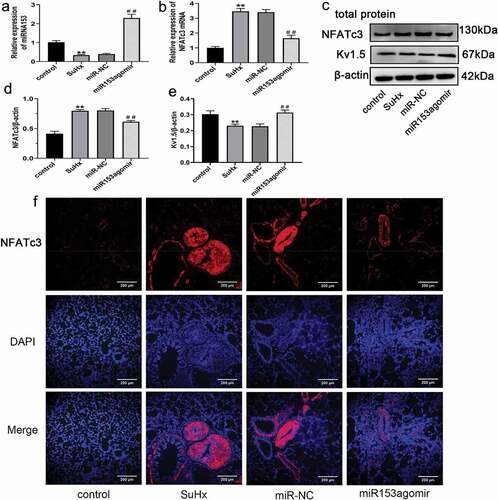
Figure 5. Effect of hypoxia on the expressions of miRNA153 and NFATc3 in PASMCs. (a, b) The mRNA expression of miRNA153 and NFATc3 in PASMCs determined by RT-qPCR. (c) Western blot analysis of NFATc3 total protein in PASMCs. (d) The protein from nucleus of PASMCs analyzed with western blotting. (E)Immunofluorescence images showing translocation of NFATc3 (green) into DAPI-stained nuclei (blue) in normoxia and hypoxia treated PASMCs (400× magnification). Comparisons were performed using one-way ANOVA followed by Dunnett’s post hoc test. *P < .05, **P < .01 vs hypoxia 0 h group. The results are represented as the mean ± SEM. N, normoxi Hy, hypoxia; miRNA153, microRNA153; PASMCs, pulmonary arterial smooth muscle cells; RT-qPCR, quantitative real-time polymerase chain reaction; NFATc3, nuclear factor of activated T cell isoform c3; SEM, standard error of mean.
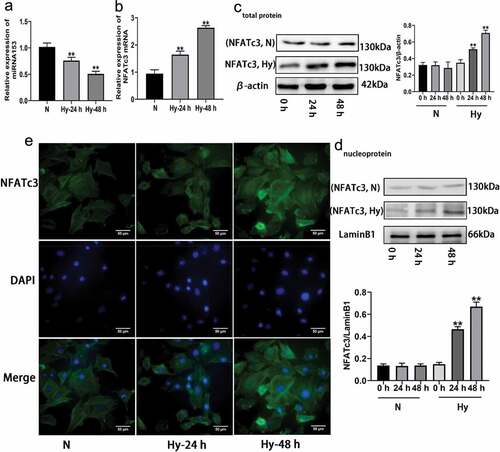
Figure 6. Effect of miRNA153 on hypoxia -induced proliferation and resistance to apoptosis of PASMCs. (a) The expression of miRNA153 in PASMCs after transfection with miR153mimic assessed by RT-qPCR. (b) The viability of PASMCs obtained by CCK-8. (c, d, e) Immunoblot analysis of PCNA, Bax, Bcl-2 from PASMCs. (f) Using flow cytometer for apoptosis to assess miR153mimic on hypoxia-induced PASMCs. *P < .05, **P < .01 vs normoxia group; #P < .05, ##P < .01 vs miR-NC group. The results are expressed as the mean ± SEM. miRNA153, microRNA153; PASMCs, pulmonary arterial smooth muscle cells; SEM, standard error of mean.
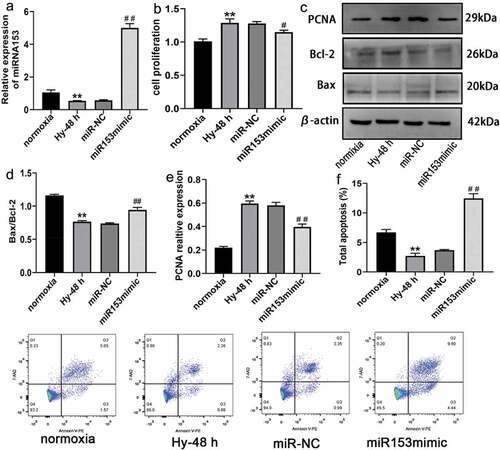
Figure 7. CsA increase the expression of Kv1.5 in PASMC after hypoxia exposure. (a) The protein trace of NFATc3 and Kv1.5 in PASMCs were detected by western blot assay. (b, c) Western blot analysis of NFATc3 and Kv1.5 in PASMCs treated with CsA. Comparisons were performed using one-way ANOVA followed by Bonferroni’s post hoc test. *P < .05, **P < .01 vs normoxia group; #P < .05, ##P < .01 vs Hy-48 h group. The results are expressed as the mean ± SEM. CsA, Cyclosporine; Kv1.5, potassium voltage-gated channel subfamily A member 5; PASMCs, pulmonary arterial smooth muscle cells; SEM, standard error of mean.
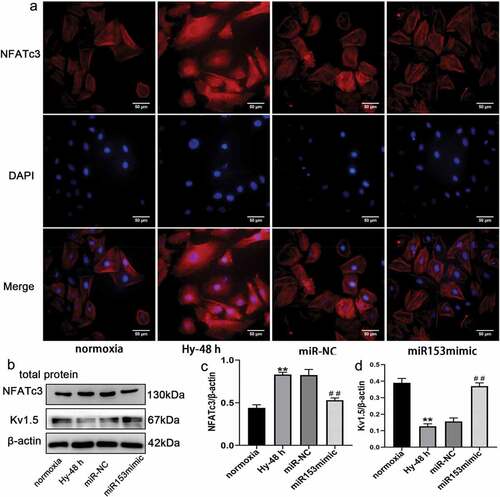
Figure 8. Over expression of miRNA153 reverses the hypoxia-reduced expression of Kv1.5 in PASMCs. (a) Immunofluorescence images showing translocation of NFATc3(red) into DAPI-stained nuclei (blue) in PASMCs (400× magnification). (b, c, d) Immunoblot analysis of NFATc3 and Kv1.5 from PASMCs treated with miR153mimic. *P < .05, **P < .01 vs normoxia group; #P < .05, ##P < .01 vs miR-NC group. The results are expressed as the mean ± SEM. miRNA153, microRNA153; Kv1.5, potassium voltage-gated channel subfamily A member 5; PASMCs, pulmonary arterial smooth muscle cells; NFATc3, nuclear factor of activated T cell isoform c3; SEM, standard error of mean.