
Figures & data
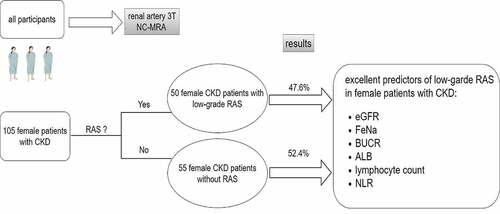
Table 1. Baseline characteristics of subjects included according to with or without RAS.
Table 2. The association of ALB, lymphocyte count, fibrinogen, SP, BUN and NLR with low-grade RAS in female patients with CKD.
Figure 1. The proportion of low-grade RAS in ALB, lymphocyte count, fibrinogen, SP,BUN and NLR tertiles.(A) The proportion of low-grade RAS in ALB tertiles. (B) The proportion of low-grade RAS in lymphocyte count tertiles. (C) The proportion of low-grade RAS in fibrinogen tertiles. (D) The proportion of low-grade RAS in SP tertiles. (E) The proportion of low-grade RAS in BUN tertiles. (F) The proportion of low-grade RAS in NLR tertiles.
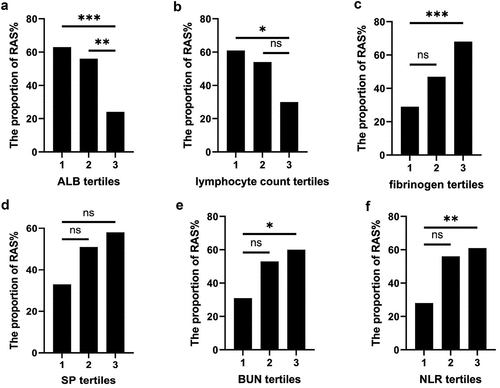
Figure 2. Logistic regression estimation of the effect of ALB, lymphocyte count, fibrinogen, SP, BUN and NLR on low-grade renal artery stenosis. (A) Multinomial-adjusted ORs for low-grade RAS according to ALB tertiles; the first tertile was used as a reference. (B) Multinomial-adjusted ORs for low-grade RAS according to lymphocyte tertiles; the first tertile was used as a reference. (C) Multinomial-adjusted ORs for low-grade RAS according to fibrinogen tertiles; the first tertile was used as a reference. (D) Multinomial-adjusted ORs for low-grade RAS according to SP tertiles; the first tertile was used as a reference. (E) Multinomial-adjusted ORs for low-grade RAS according to BUN tertiles; the first tertile was used as a reference.(F) Multinomial-adjusted ORs for low-grade RAS according to NLR tertiles; the first tertile was used as a reference.
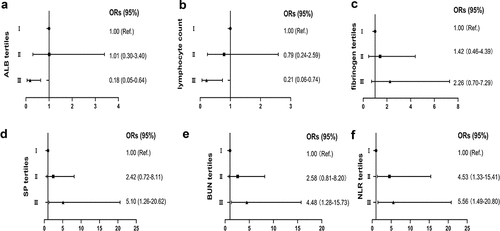
Figure 3. ROC curve of the diagnostic accuracy of lymphocyte count, NLR, ALB, eGFR, UBCR, and FeNa in low-grade renal artery stenosis.
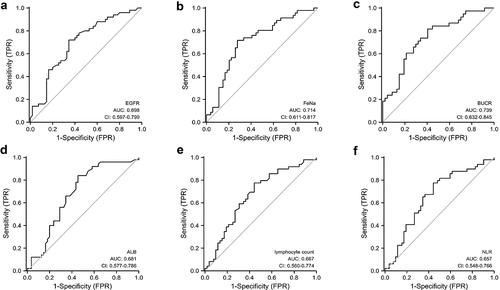
Table 3. The outcome of ROC of the following variables predicting low-grade renal artery stenosis.