
Figures & data
Figure 1. Optical coherence tomography angiography 6×6mm scan image centered on the optic disc. The diameters of the three concentric circles are 1, 3, and 6mm. The measurement tool (AngioPlex software, version 10.0; Carl Zeiss Meditec) provided (a) vessel density and (b) perfusion density measurements in individual subfields. The bold box shows the automatic quantitative measurements for an average of the inner ring, outer ring, and full area.
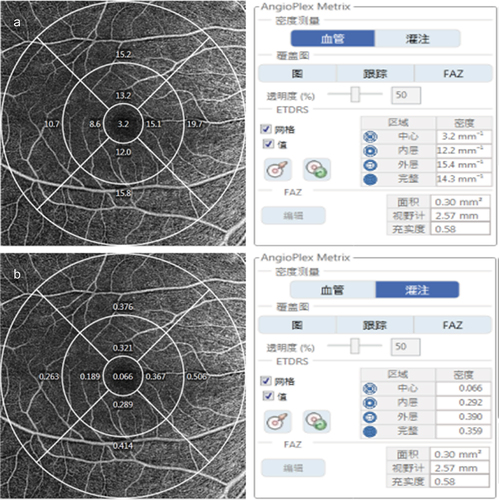
Table 1. Demographics and clinical features of the study subjects.
Table 2. ABPM parameters of all patients and controls.
Table 3. Comparison of RNFL thickness, ILM-RPE mean volume thickness, VD and PD among groups.
Table 4. Multivariate regression analysis of OCT parameters and OCTA parameters with baseline indexes and blood pressure variability.