
Figures & data
Figure 1. CircUSP9X is upregulated in as and ox-LDL-stimulated VSMCs. (a) CircUSP9X expression in the serum acquired from patients with as and healthy individuals. (b) cell viability was analyzed after VSMC treatment with 0, 25, 50, 75, and 100 μg/ml ox-LDL. (c) cell viability was analyzed after VSMC treatment with ox-LDL for 0, 12, 24, and 36 h. (d) CircUSP9X was examined in VSMCs exposed to 0, 25, 50, 75, and 100 μg/ml ox-LDL. (e) CircUSP9X was examined in ox-LDL-induced VSMCs for 0, 12, 24, and 36 h. ***P < .001. **P < .01. *P < .05.
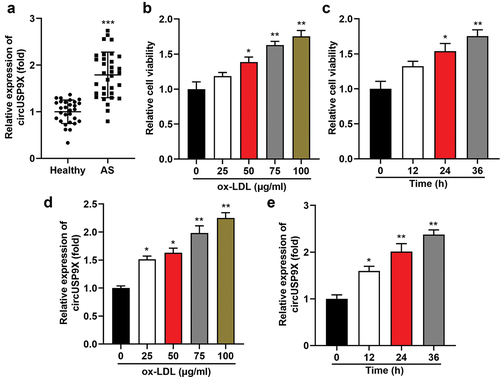
Figure 2. CircUSP9X promotes proliferation and migration in ox-LDL-induced VSMCs. (a) transfection efficiency was tested after VSMCs transfecting with vector, circUSP9X overexpressing vector, si-nc, si-circUSP9X 1#, and si-circUSP9X 2#. (b) cell viability of transfected ox-LDL-stimulated VSMCs. (c-d) EDU assay revealed cell proliferation. (E-F) Transwell assay measured cell migration, and migrated cells were quantified. (g-h) wound healing assay was used to determine cell migration. (i-m) protein levels of CDK2, cyclinE1, MMP2, and MMP9. ***P < .01 vs. The vector group, and **P < .05 vs. si-nc group in (A). *P < .01 and **P < .05 vs. The control group, #P < .05 vs. The ox-LDL + vector group, and &P < .05 vs. The ox-LDL +si-NC group in (B-M).
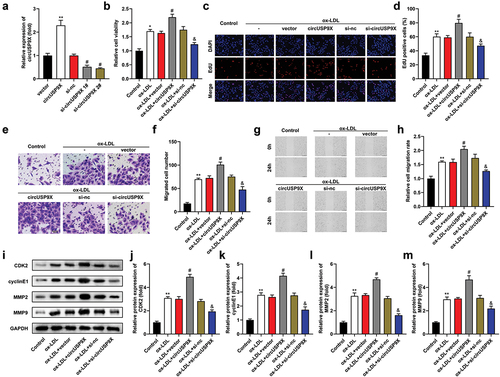
Figure 3. CircUSP9X sponges miR-599. (a) the potential complementary sites of miR-599 on circUSP9X-wt sequences. CircUSP9X-mut sequences were designed. (b) luciferase activity was tested after co-transfection. (c) CircUSP9X expression after RNA pull-down. (d) FISH analyzed the location of circUSP9X and miR-599. (e) MiR-599 expression in the serum of patients with as and healthy controls. (f) the relationship between circUSP9X and miR-599 in patients with AS. (g) MiR-599 was examined after knockdown or overexpression of circUSP9X. ***P < .001. **P < .01. *P < .05.
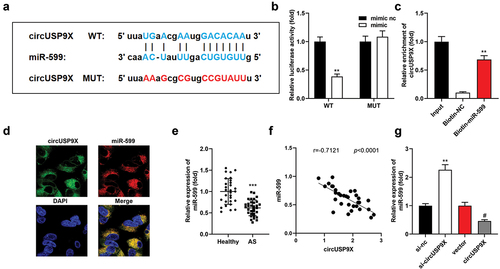
Figure 4. CircUSP9X promotes cellular processes by miR-599. (a) MiR-599 levels following transfection of mimic or inhibitor. (a) CCK-8 assessed cell viability. (C-D) EDU assay analyzed cell proliferation. Cell migration was analyzed using (e-f) transwell assay and (g-h) wound healing assay. (i-m) Western blot examined protein levels of CDK2, cyclinE1, MMP2, and MMP9, and their levels were quantified. ***P < .001 vs. mimic nc in (A) and vs. ox-LDL + vector in others. **P < .01 vs. The mimic nc group, and *P < .01 vs. The inhibitor nc group in (A). **P < .01 and #P<.05 vs. The ox-LDL + vector group, and **P < .05 vs. The ox-LDL + circUSP9X + mimic nc group in (B-M).
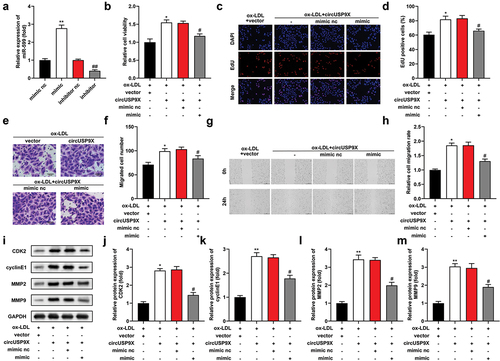
Figure 5. MiR-599 targets STIM1. (a) the potential complementary sites of miR-599 on STIM1-wt. STIM1-mut was designed. (b) luciferase activity was examined after co-transfection. (c) STIM1 expression after RNA pull-down. (d) FISH analyzed the location of STIM1 and miR-599. (e) STIM1 expression in the serum of patients with as and healthy controls. (f) the interaction of STIM1 and miR-599 in patients with AS. (g) STIM1 was examined after overexpressing or inhibiting miR-599 in VSMCs. ***P < .001. **P < .01. *P < .01.
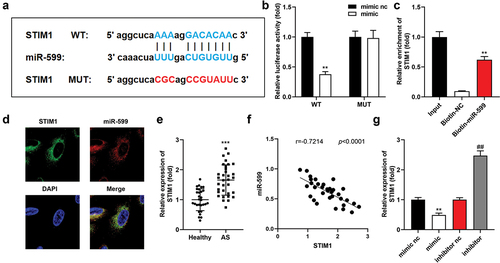
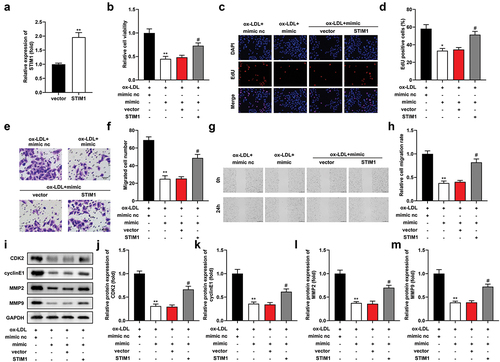
Figure 6. MiR-599 suppresses ox-LDL-induced biological function by STIM1. (a) STIM1 levels after transfecting of STIM1 overexpression vector. Cell proliferation was analyzed using (b) CCK-8 and (c-d) EDU assays. (e-f) Transwell assay and (g-h) wound healing assay assessed cell migration. (i-m) Western blot examined protein levels of CDK2, cyclinE1, MMP2, and MMP9, and their levels were quantified. ***P < .01 vs. The vector group in (a). **P < .01 and *P < .05 vs. The ox-LDL + mimic nc group. **P < .05 vs. The ox-LDL + mimic +vector group.
Supplemental Material
Download JPEG Image (687.2 KB)
Data availability statement
The datasets used and/or analyzed during the current study are available from the corresponding author on reasonable request.