Figures & data
Figure 1. Flow chart of this study.
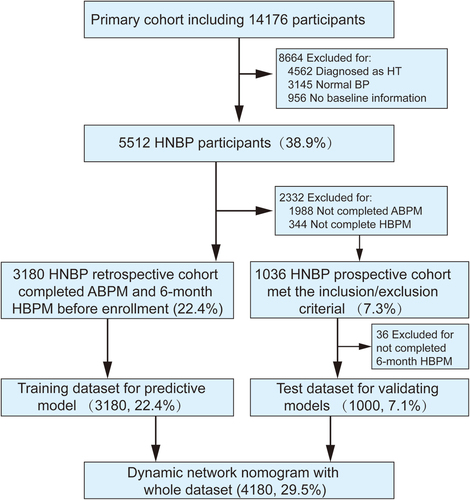
Table 1. Baseline characteristics between training and validation dataset.
Table 2. COX regression analysis of the training dataset*
Figure 2. Nomogram for new-onset hypertension in HNBP populations. To use the nomogram, locate the individual’s value on each variable axis, and draw a line upward to determine the corresponding points. The sum of these points is located on the total points axis, and a line is drawn downwards to the accumulative axes to determine the likelihood of new-onset hypertension within 6 months.
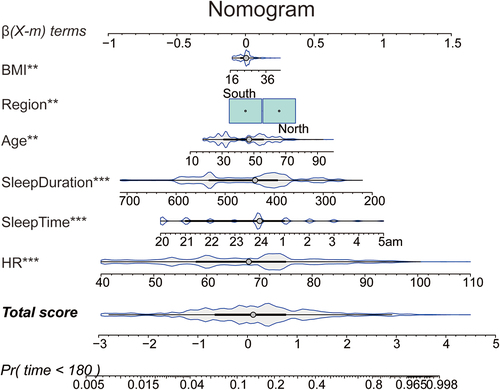
Figure 3. Restricted cubic spline diagram. (a): RCS of age. (b): RCS of BMI. (c): RCS of HR. (d): RCS of sleep duration.
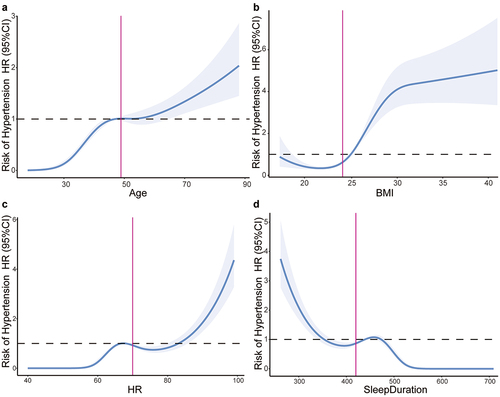
Figure 4. The calibration curve for predicting new-onset hypertension at 6-month in the training set and validation set. (a): the calibration curve for predicting new-onset hypertension at 6 months in the training set. (b): the calibration curve for predicting new-onset hypertension in 6-month in the validation set.
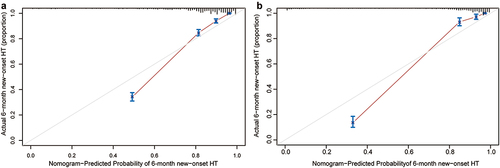
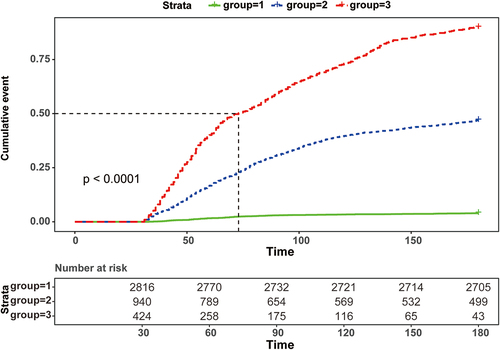
Figure 5. Kaplan-Meier cumulative curve of the whole dataset. Low-risk group: 0–7.81 scores; middle-risk group: 7.82–9.93 scores; high-risk group: ≥9.94 scores.