Figures & data

Figure 1. CA improved DN in mice model.
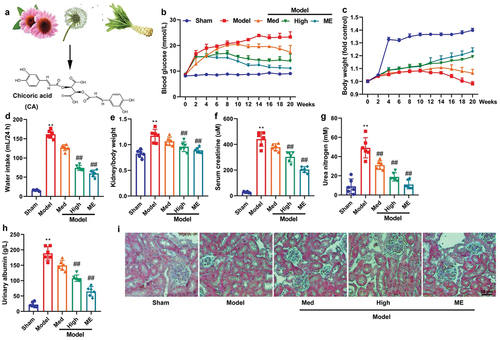
Figure 2. CA reduced acute kidney injury (AKI) and inflammation in mice model or in vitro model.
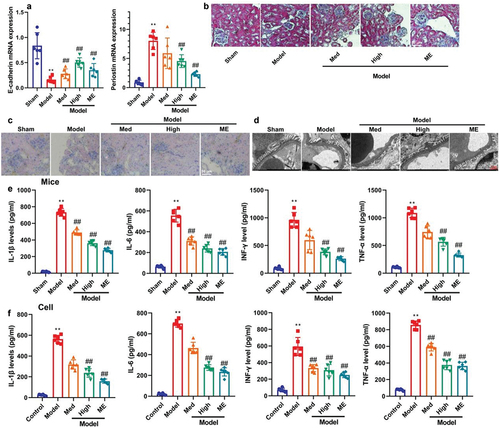
Figure 3. CA reduced high glucose-induced ferroptosis of NRK-52E through the induction ferroptosis of GSH/GPX4 axle.
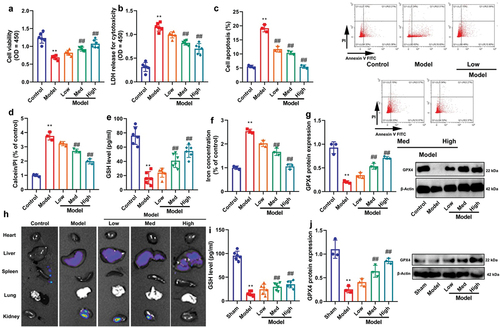
Figure 4. Ferroptosis activator reduced the effects of CA on DN in mice model or in vitro model.
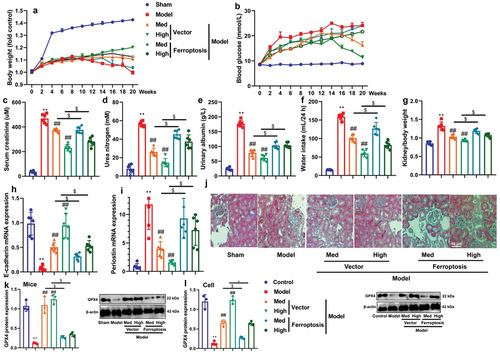
Figure 5. CA suppressed PAQR3 expression in model of DN to promote PI3K/AKT axle.
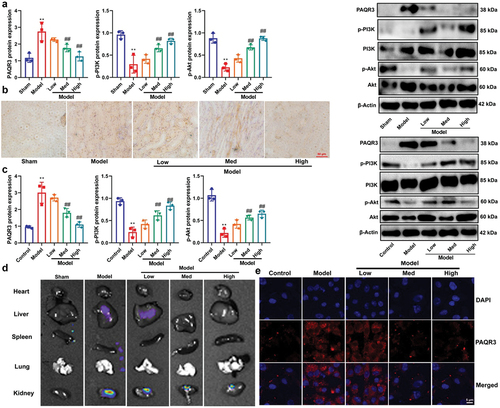
Figure 6. PAQR3 activator reduced the effects of CA on DN in vitro model.
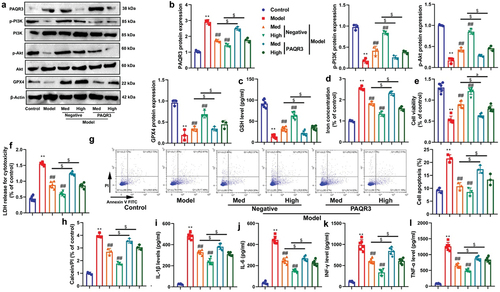
Figure 7. CA directly targeted the PAQR3 protein to advance ubiquitination of PAQR3 protein.
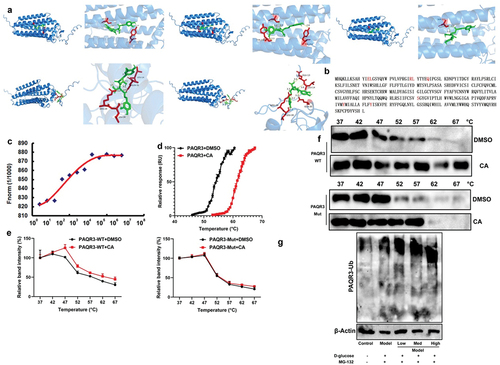
Figure 8. PI3K inhibitor the effects of CA on DN in mice model.
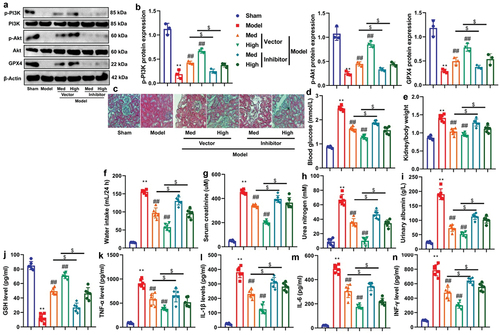
Figure 9. CA reduced the interaction between PAQR3 and P110α pathway to induce PI3K/AKT signaling pathway.
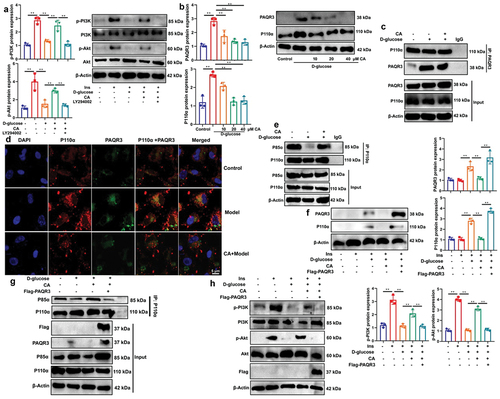
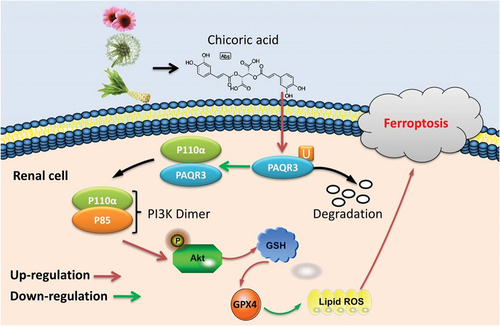
Figure 10. Chicoric acid advanced PAQR3 ubiquitination to ameliorate Ferroptosis in diabetes nephropathy through the relieving of the interaction between PAQR3 and P110α pathway.