Figures & data
Figure 1. IFN-γ of different concentrations enhances the proliferation ability of hUC-MSCs.
(a) The proliferation rate of hUC-MSCs after treatment with IFN-γ for 24 hours was determined by immunofluorescence staining, scale bar = 100 μm, n = 6 per group. (b) Clonogenic capacity of hUC-MSCs after 24 hours of IFN-γ treatment, scale bar = 200 μm, n = 6 per group. (c) The proliferative capacity of hUC-MSCs after 24 hours of IFN-γ treatment via Real Time Cellular Analysis (RTCA), 1500 cells per well, n = 5 per group.
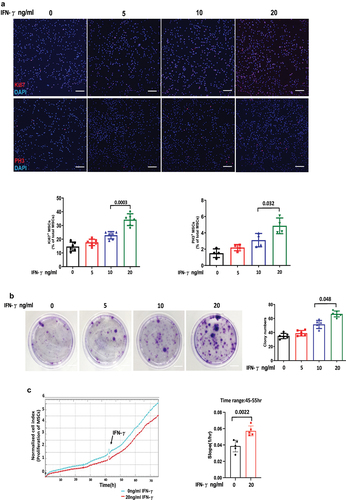
Figure 2. IFN-γ of different concentrations increases the migration ability of hUC-MSCs.
(a) Scratch assay demonstrated the migration ability of hUC-MSCs after 24 hours of IFN-γ treatment, scale bar = 200 μm, n = 6 per group. (b) Transwell assay demonstrated the migration ability of hUC-MSCs after 24 hours of IFN-γ treatment, scale bar = 100 μm, n = 6 per group. (c) The migration capacity of hUC-MSCs after 24 hours of IFN-γ treatment via Real Time Cellular Analysis (RTCA), 1000 cells per well, n = 5per group.
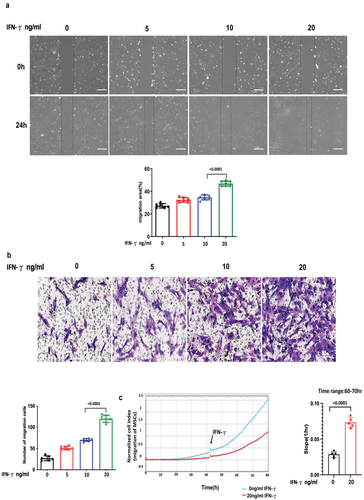
Figure 3. IFN-γ of different concentrations has minner effect on the stemness properties of hUC-MSCs as identified by induction of three-lineage differentiation and surface markers.
(a) Osteogenic, adipogenic and chondrogenic induction experiments were performed to demonstrate the effect of IFN-γ on the differentiation of hUC-MSCs into three lineages, scale bar = 50 μm, n = 3 per group. (b) Effect of IFN-γ treatment for 24 hours on hUC-MSCs surface markers was determined by flow cytometry. The 24-hr IFN-γ treatment had no significant impact on the expression of surface markers, except for CD73, n = 3 per group. For B, all bars express mean ±SD and data are analyzed using Tukey’s multiple comparison test.
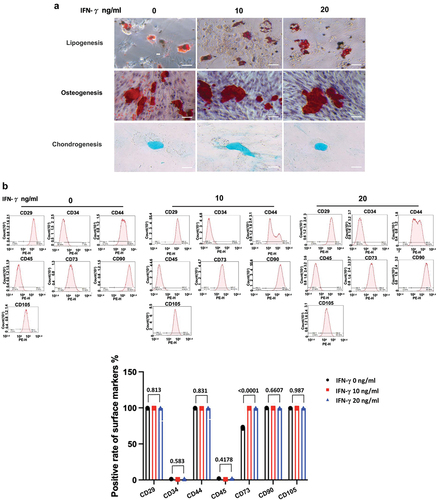
Figure 4. Loss of CD151 attenuates the effect of IFN-γ on the proliferation and migration of hUC-MSCs.
(a) Gene ontology (GO) analysis of upregulated genes in hUC-MSCs before and after IFN-γ treatment (relative to control group) show multiple, significantly enriched GO terms relevant to cell proliferation/migration. (b) Bubble diagram of upregulated proliferation/migration regulators (relative to control group). (c-d) Validation of selected proliferation/migration regulators from RNA-seq by qRT-PCR and immunoblotting. (n = 3 samples per group in C and D) Representative immunoblots (left) and quantification of protein levels (right) are shown in D. versus control group. (e) The dynamic bias of differentially expressed genes in control and IFN-γ hUC-MSCs. Gene set enrichment analysis was used to analyze clusters of genes that regulate proliferation/migration. For C and D, all bars express mean ±SD and data are analyzed using the two-tailed unpaired Student’s t test.
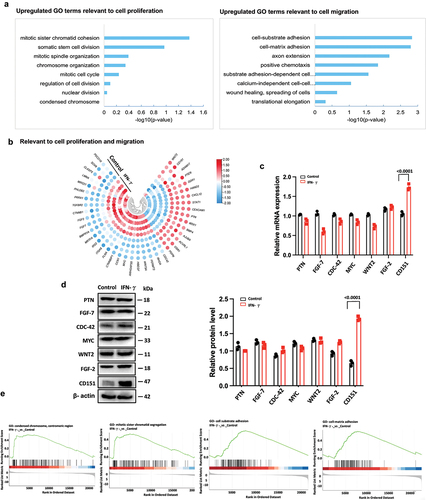
Figure 5. CD151 increases PI3K and AKT phosphorylation on promoters of proliferation/migration in hUC-MSCs.
(a) Changes in PI3K/AKT signaling and CD151 expression after IFN-γ treatment. Immunoblotting was performed to show global changes of histone modifications, using proteins extracted from hUC-MSCs in third-generation control or IFN-γ treatment (IFN-γ) for 24 hours (n = 3 samples per group). Representative immunoblots (left) and quantification of protein level (right) are shown. versus the control group. (b) Changes of PI3K and AKT phosphorylation induced by IFN-γ treatment under (si-NC) or CD151 siRNA. Immunoblotting was performed to show global changes of PI3K and AKT phosphorylation, using proteins extracted from hUC-MSCs in third-generation control or IFN-γ treatment (IFN-γ) for 24 hours (n = 3 samples per group). Representative immunoblots (left) and quantification of protein level (right) are shown. versus si-NC group. (c) The enhancement effect of IFN-γ-induced proliferation of hUC-MSCs was attenuated by CD151 siRNA by immunofluorescence staining, scale bar = 100 μm, n = 5 per group. Representative of the Ki67/PH3 positive cells (left) and quantification of Ki67 and PH3 (right) are shown. versus si-NC group. (d&e) Scratch assay and transwell assay demonstrated the enhancement effect of IFN-γ-induced migration of hUC-MSCs was attenuated by CD151 siRNA, respectively, scale bar = 200 μm, n = 5 per group for d. scale bar = 100 μm, n = 5 per group for e. Representative (left) and quantification (right) of the migration area (right) are shown. versus si-NC group.
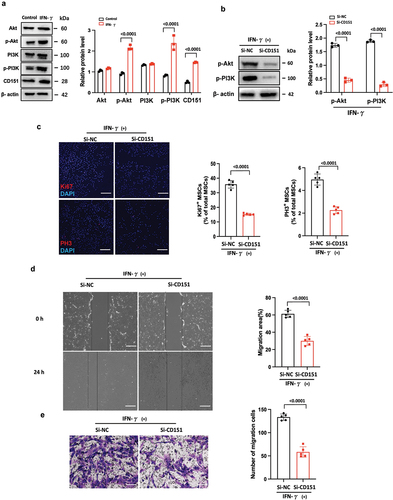
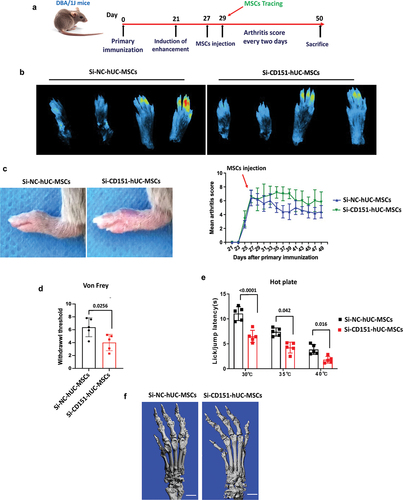
Figure 6. Knockdown of CD151 attenuates the local recruitment capacity and therapeutic effect of MSCs on CIA mice.
(a) The schematic depicts the procedure for CIA induction and subsequent MSC treatment. (b) The number of si-CD151-hUC-MSCs in the toes was significantly reduced compared with the si-CD151-hUC-MSCs group, n = 5 per group. (c) Evaluation of joint swelling was conducted according to the following study criteria: 1) Mild tarsal or ankle swelling; 2) Mild swelling from ankle joint to metatarsal joint; 3) Moderate swelling of ankle to metatarsal joints; and 4) Severe swelling of ankles, feet, and toes. Each limb was individually scored and supplemented, n = 6 per group. (d&e) The thermal pain threshold and mechanical pain threshold of CIA mice treated with si-NC-hUC-MSCs and si-CD151-hUC-MSCs were measured using a thermal pain detector and von Frey filaments, respectively. n = 6 per group. (f) Representative CT images are shown indicating joint and bone destruction. scale bar = 1 mm.