Figures & data
Table1. Examples on various ARGs, MGEs and antibiotics found in different water environments.
Table 2. Sub-inhibitory concentrations of selection pressures induce antibiotic resistance.
Figure 1. Quantitative microbial risk assessment (QMRA) procedure for assessing the human health risks by ARB and ARGs in aquatic environment. The diagram briefly describes the process and provide summarizes the current knowledge.
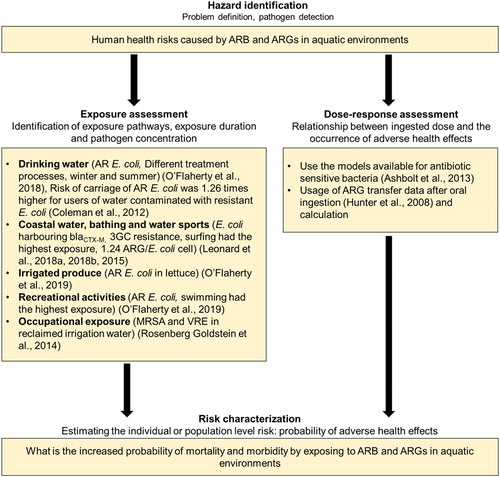
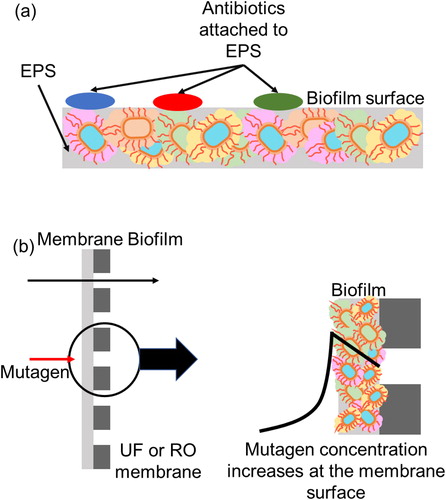
Figure 2. Hypothesis for new antibiotic resistance hotspots. (a) Attachment of antibiotics to EPS can increase the antibiotic concentration in the biofilm surface layer and can act as a selective pressure, (b) Elevated concentration of chemicals in the vicinity of ultrafiltration and reverse osmosis treatment systems membrane surface can act as mutagens and can lead to the development of antibiotic resistance in the bacteria in gel/cake layer and surroundings via mutation.