Figures & data
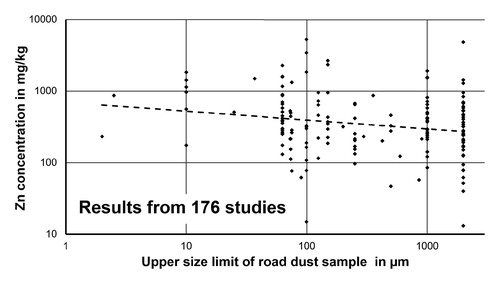
Figure 1. RDS studies included in the evaluation.
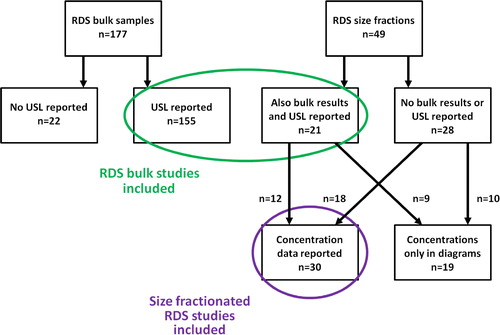
Figure 2. Annual number of studies investigating RDS metal concentrations.
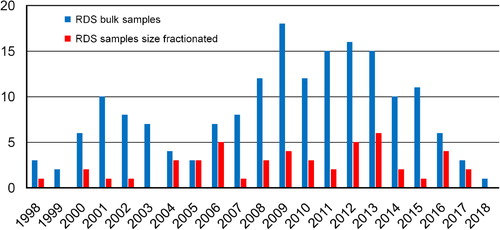
Figure 3. Frequency of use of various upper size limits (USLs) for RDS bulk samples.
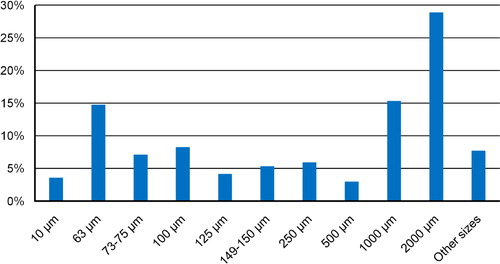
Figure 4. Concentrations of Cu, Pb and Zn as a function of the USL applied in sample preparation.
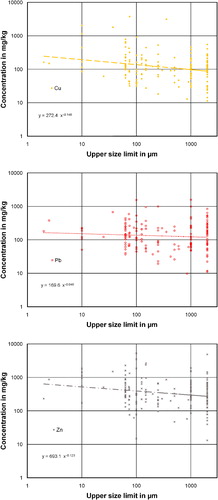
Table 1. Average RDS bulk sample concentrations of metals in 176 studies reporting the USL of the sample.
Figure 5. Size ranges of the RDS size fractions investigated.
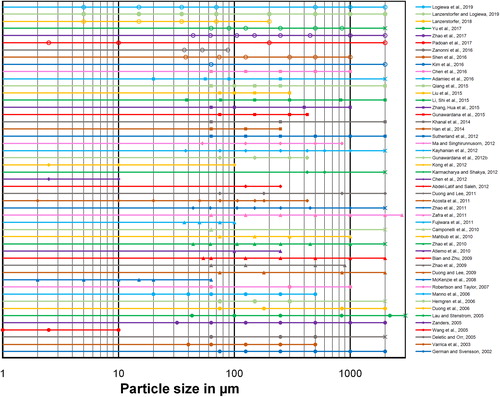
Figure 6. Relative concentration of Cu, Pb, and Zn based on the calculated concentrations for a particle size of 63 µm.
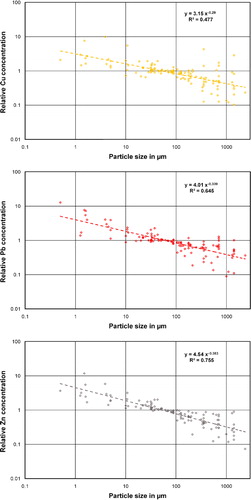
Table 2. Suggested size fractions for RDS studies.