Figures & data
Table 1. Reported and recommended rate constants for mercury methylation ( and methylmercury demethylation (
for aquatic sediments.
Figure 1. Experimental data from Hintelmann et al. (Citation2000), Rodrı́guez Martı́n-Doimeadios et al. (Citation2004), and Jonsson et al. (Citation2012) for Hg measured at time = 0 and MeHg measured at time = t (black circles) superimposed with integrated first-order rate law for Hg methylation shown as the equation for a straight line y = mx + b: where m = –km and b = 0.
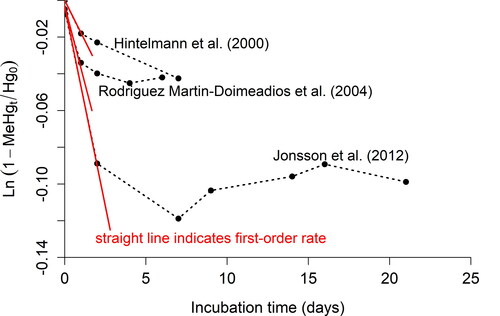
Figure 2. Mercury methylation rate constant ( as a function of total sediment mercury concentration [Hg]tot reported by Kim et al. (Citation2006); Mitchell and Gilmour (Citation2008); Hollweg et al. (Citation2010); Marvin-DiPasquale et al. (Citation2014). Error bars on data are uncertainties reported in studies. All studies assumed a pseudo-first-order rate and used single time point measurements after a 2-hr incubation time to calculate
The solid line represents the linear least-squares best fit for all data points, and the dashed line represents the 95% confidence interval.
![Figure 2. Mercury methylation rate constant (km) as a function of total sediment mercury concentration [Hg]tot reported by Kim et al. (Citation2006); Mitchell and Gilmour (Citation2008); Hollweg et al. (Citation2010); Marvin-DiPasquale et al. (Citation2014). Error bars on data are uncertainties reported in studies. All studies assumed a pseudo-first-order rate and used single time point measurements after a 2-hr incubation time to calculate km. The solid line represents the linear least-squares best fit for all data points, and the dashed line represents the 95% confidence interval.](/cms/asset/4122ed3a-0486-4457-9f8f-4d53e49f0f74/best_a_2013073_f0002_c.jpg)
Figure 3. Maximum observed methylmercury demethylation rate constants () per site (one or more samples per site) from selected publications. Studies assumed a pseudo-first-order rate and used 6–48 hr incubation times. With identified Hg source means that a Hg-emitting mine or industry lies within approximately 70 km upstream of the site, and no identified Hg source means that no source is present or lies more than 70 km upstream. Sources: a (Marvin-DiPasquale et al., Citation2000), b (Marvin-DiPasquale and Oremland, Citation1998), c (Marvin-DiPasquale et al., Citation2003), d (Tjerngren et al., Citation2012), e (Kronberg et al., Citation2012), f (Kronberg et al., Citation2018), g (Rodrı́guez Martı́n-Doimeadios et al., Citation2004), h (Hintelmann et al., Citation2000), i (Drott et al., Citation2008b).
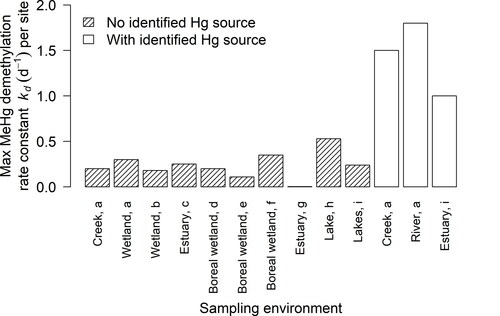
Figure 4. Parameters sulfate (a), pH (b), sulfide (c), and dissolved THg (d) measured (red dots) by Schwartz and Gilmour (Citation2017) during incubation experiments with controlled conditions in comparison to PHREEQC simulation performed in this study (solid lines). Initial conditions of the simulation (Supporting Information Table S7) were based on initial conditions of the incubation.
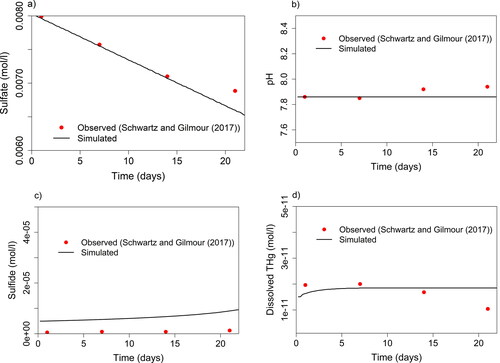
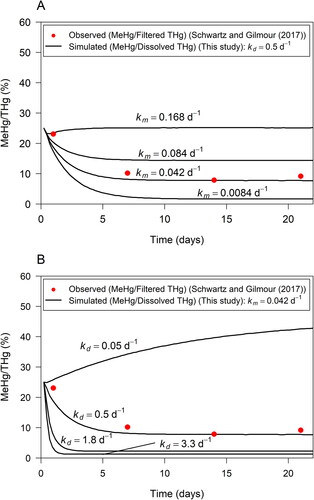
Figure 5. Sensitivity of simulated MeHg/Dissolved THg ratio (black line) to Hg methylation rate constant (a) and MeHg demethylation rate constant
(b). MeHg/Filtered THg ratios observed in porewater in incubation experiments by Schwartz and Gilmour (Citation2017) shown by red dots.