Figures & data
Figure 1. (a) Targets of oxidative action of ozone for SARS-CoV-2 virus inactivation; (b) possible mechanism of virucidal action of ozone.
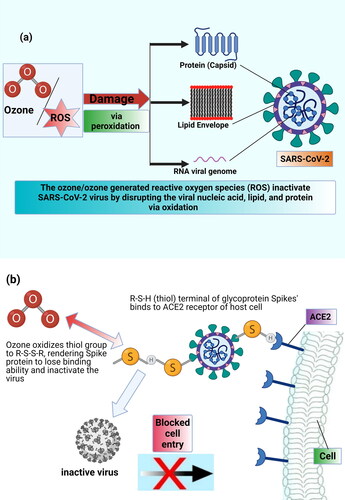
Figure 2. (a) Pseudo-first-order rate constants, k’V, of ozone inactivation of surface SARS-CoV-2 obtained for different experimental conditions; (b) Effect of ozone gas concentration on required time to attain ∼99% virus inactivation (RH∼50–60%). Experimental conditions—(Support material, virus solution, RH, volume of virus solution spread on the support material, physical state of the sample at the start of ozonation): R1: (Plastic, CCM, RH 50%, 0.5 µL, not dry) (De Forni et al., Citation2021); R2: (SS, CCM, RH 55%, 50 µL, not dry) (Percivalle et al., Citation2021); R3: (SS, CCM centrifuged at low speed and filtered, RH 80%, 50 µL, dry) (Murata et al., Citation2021); R4: (Plastic, CCM, RH 55%, 50 µL, not dry) (Percivalle et al., Citation2021); R5: (SS, CCM filtered and washed with phosphate solution, RH 70%, 50 µL, dry) (Yano et al., Citation2020); R6: (SS, CCM centrifuged at low speed and filtered, RH 55%, 50 µL, dry) (Murata et al., Citation2021); R7: (Plastic, CCM, RH ?%, 50 µL, ?) (Criscuolo et al., Citation2021); R8: (Filter paper, CCM, RH 52%, ? µL, ?) (Volkoff et al., Citation2020)—SARS-CoV-2 RNA; R9: (Plastic, complex mixture of CCM, RH 60%, 13 µL, not dry) (Zucker et al., Citation2021)—pseudovirus; CCM: cell culture medium; SS: stainless steel; RH: relative humdity.
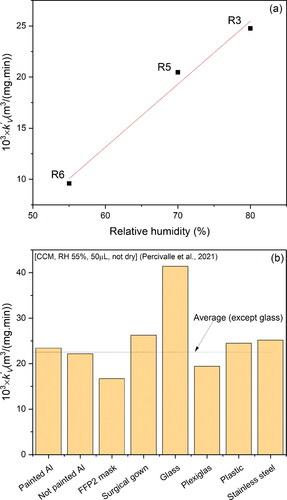
Figure 3. Effects of (a) RH and (b) different support materials on k’V. Rx indicates the source of data (see for details).