Figures & data
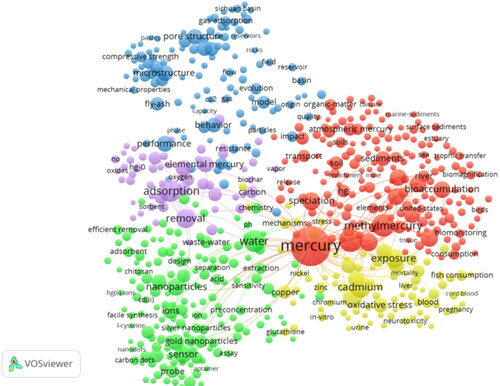
Figure 1. Scientometric visualization of the top 600 keywords of all peer-reviewed publications from 2018. A total of 19,305 publications were retrieved from Web of Science with “mercury”as the searching keyword (all fields), and the database was selected as the “Web of Science Core Collection.” Collected data were analyzed using the built-in function of co-occurrence of all keywords, being plotted in “network visualization” using VOSviewer. Each circle represents a keyword, while its size represents the number of times that a pair of keywords has co-occurred in publications.