Figures & data
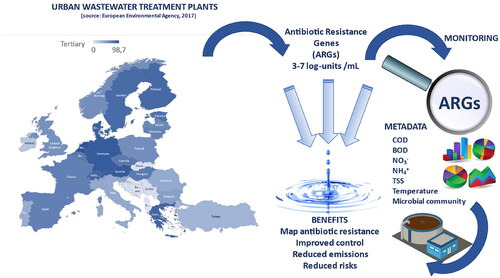
Figure 1. Abundance of genes determined based on quantitative PCR in the raw influent (IN) and final effluent (OUT) of UWTPs in different countries and published in different studies. Data corresponds to determinations made in n UWTPs: 16S rRNA gene (n = 125 IN; n = 32 OUT); intI1 (n = 80 IN; n = 18 OUT); sul1 (n = 17 IN; n = 16 OUT); aadA (n = 11 IN; n = 10 OUT); ermF (n = 13 IN; n = 10 OUT); tet (n = 18 IN; n = 12 OUT); blaOXA (n = 12 IN; n = 9 OUT); qnrS (n = 7 IN; n = 6 OUT). Please see text and Table SI-1 for other details.
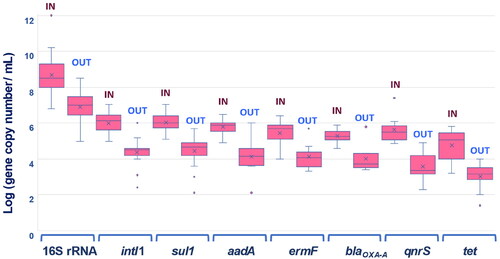
Figure 2. Pathways of dissemination and/or removal of antibiotic resistance by urban wastewater treatment plants and potential impacts. Examples of sensitive areas that may be impacted by UWTPs are provided: areas subjected to other pollution sources (industry, intensive agriculture); areas that can experience overflow and flood events or with limited dilution capacity, particularly in drought regions and/or seasons; discharging in proximity to recreational areas or where water for drinking water production or agricultural irrigation are collected.
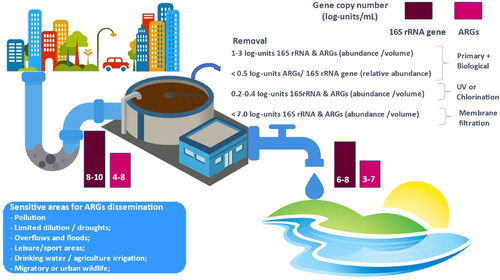
Table 1. Examples of intrinsic and exogenous factors (fitness drivers) that may influence the success of an ARB in wastewater or related environment.
Table 2. Summary of most common methodological options for ARB/ARG monitoring in wastewater and related samples.
Table 3. Examples of biomarkers that might be used to monitor AR removal in UWTPs, impacts on the environment, and to establish a first line of human-health risk assessment.
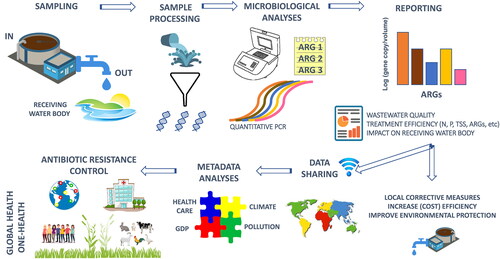
Figure 3. Proposed flow diagram for ARG monitoring in UWTPs to measure treatment efficiency, assess impacts, and to support the design of corrective interventions. Where, refers to preferential sampling sites; When, refers to periodicity of monitoring; How, summarizes the procedures; What, proposes what should be analyzed and the expected reporting outputs.
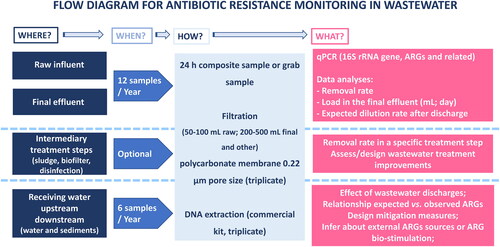
Figure 4. Workflow of ARG monitoring in UWTPs and the immediate/local and medium-term/global expected implications.