20,196
Views
122
CrossRef citations to date
0
Altmetric
Methodology Review

Timing and Tracking: Unlocking Visitor Behavior

&
Pages 47-64 | Published online: 16 Apr 2009

Figures & data

Table 1 Sharks: Myth and mystery, percentage of total time spent by visitors based on type of exhibit

Figure 1 Percentage of total time spent by visitors in general. Copyright 2006 Monterey Bay Aquarium Foundation.
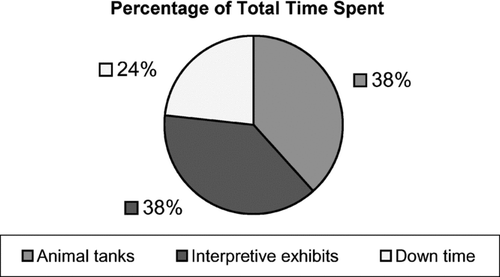
Figure 1 Percentage of total time spent by visitors in general. Copyright 2006 Monterey Bay Aquarium Foundation.

Table 2 Nearshore exhibition, stopping at each exhibit

Table 3 Nearshore exhibtion, time spent when stopping by exhibit

Figure 2 Sharks: Myth and Mystery exhibition, percentage of visitors stopping at each exhibit. Note: Darker shading indicates areas of relatively high visitor usage (top 1/3 of elements); mid-level shading indicates areas of intermediate visitor usage (mid 1/3 of elements); lighter shading indicates areas of relatively low visitor usage (low 1/3 of elements), in terms of the percentage of visitors who stopped to attend to the element. An example in color can be seen at http://www.informalscience.org/evaluations/report_227.PDF Appendix C. Copyright 2006 Monterey Bay Aquarium Foundation.
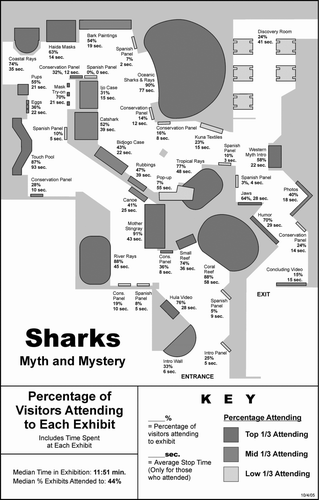
Figure 2 Sharks: Myth and Mystery exhibition, percentage of visitors stopping at each exhibit. Note: Darker shading indicates areas of relatively high visitor usage (top 1/3 of elements); mid-level shading indicates areas of intermediate visitor usage (mid 1/3 of elements); lighter shading indicates areas of relatively low visitor usage (low 1/3 of elements), in terms of the percentage of visitors who stopped to attend to the element. An example in color can be seen at http://www.informalscience.org/evaluations/report_227.PDF Appendix C. Copyright 2006 Monterey Bay Aquarium Foundation.

Figure 3 Sharks: Myth and Mystery exhibition, average time spent each exhibit. Note: Darker shading indicates areas of longer visitor stops (top 1/3 of elements); mid-level shading indicates areas of mid-length visitor stops (mid 1/3 of elements); lighter shading indicates areas of shorter visitor stops (low 1/3 of elements), in terms of the average time spent at the exhibit by those who stopped. An example in color can be seen at http://www.informalscience.org/evaluations/report_227.PDF Appendix D. Copyright 2006 Monterey Bay Aquarium Foundation.
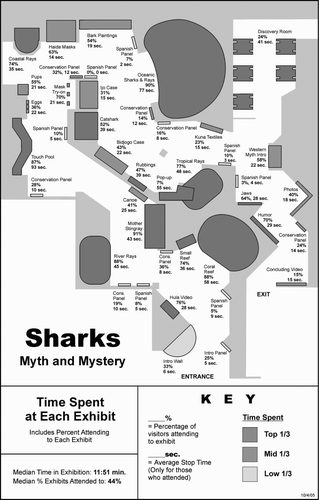
Figure 3 Sharks: Myth and Mystery exhibition, average time spent each exhibit. Note: Darker shading indicates areas of longer visitor stops (top 1/3 of elements); mid-level shading indicates areas of mid-length visitor stops (mid 1/3 of elements); lighter shading indicates areas of shorter visitor stops (low 1/3 of elements), in terms of the average time spent at the exhibit by those who stopped. An example in color can be seen at http://www.informalscience.org/evaluations/report_227.PDF Appendix D. Copyright 2006 Monterey Bay Aquarium Foundation.

Reprints and Corporate Permissions

Please note: Selecting permissions does not provide access to the full text of the article, please see our help page How do I view content?

To request a reprint or corporate permissions for this article, please click on the relevant link below:

Academic Permissions

Please note: Selecting permissions does not provide access to the full text of the article, please see our help page How do I view content?

Obtain permissions instantly via Rightslink by clicking on the button below:

If you are unable to obtain permissions via Rightslink, please complete and submit this Permissions form. For more information, please visit our Permissions help page.