
Figures & data
Table 1. Values, including analytical methods, for agronomic, physical, and chemical properties of biochar feedstock.
Table 2. Physical and chemical properties of chicken manure and wood shavings feedstocks.
Table 3. Mean dry weights in kgs (± SD, n = 3) at beginning (day 0) and end (day 34) of composting for elements in each of three composting treatments (control, Biochar 20%, and Biochar 40%).
Table 4. Wet and dry application rates (Mg ha-1) for each compost treatment (control compost, Biochar 20%, and Biochar 40%) at the low (7 Mg dry C ha-1) and high (15 Mg dry C ha-1) amendment rates.
Table 5. Mean values for compost bulk density (BD) and moisture content (MC) for each of three treatments at three collection periods day 0, 13, and 34.
Figure 1. Compost temperatures for each of three treatments at two depths, 40.6 (deep) and 81.3 cm (shallow) measured from the base. Panels (a) and (b), and (c) and (d), illustrate temperatures within the first five days and the remaining 29 days, respectively. Bars are standard error of the mean for daily mean temperature (n = 3).
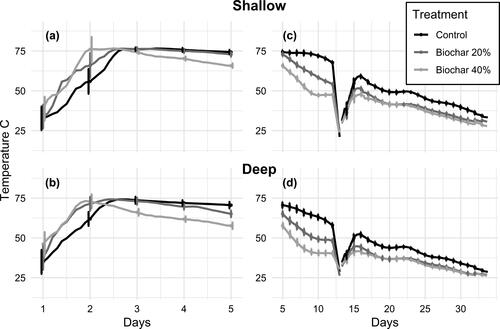
Table 6. Mean values for compost chemical and nutrient properties in each of three treatments collected at days 0 (D0) and 34 (D34) of composting.
Table 7. Mass (kgs) and percent change from day 0 to day 34 in total C, total N, NO3-N, and NH4-N in different composting elements (top cap, compost, plenum).
Figure 2. Nitrogen loss from the total initial mass, including biochar (a) and the non-biochar compost (b).
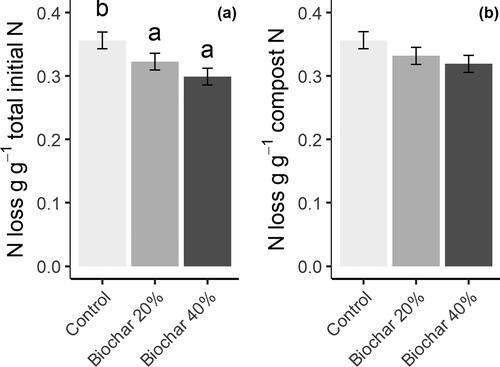
Table 8. Compost physical and chemical properties for each of three treatments after curing and immediately prior to amendment.
Table 9. Mean values for soil physical and chemical properties following amendment and one potato growing season.
Table 10. Mean values for potato plant biomass following amendment including above (leaves) and below ground (tuber) variables.
Data Availability Statement
Data that support the findings of this study are available at zenodo.org with the identifier: http://doi.org/10.5281/zenodo.4763775.