Figures & data
Figure 1. (a) XRD pattern (solid line) of carbonated hydroxyapatite (CHA) with XRD peaks of synthetic HA (ICDD: 09–0432, dotted line) (b) FTIR spectrum and (c) TEM image of CHA synthesised.
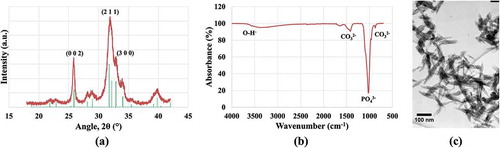
Figure 2. PHEMA/PCL-nCHA composite coatings onto Ti-6Al-4V discs (a) 0 wt.% nCHA (b) 5 wt.% nCHA (c) 10 wt.% nCHA; the inset depicting the same composition coating in a tilt view (d) 12 wt.% nCHA (e) 15 wt.% nCHA (f) 20 wt.% nCHA.
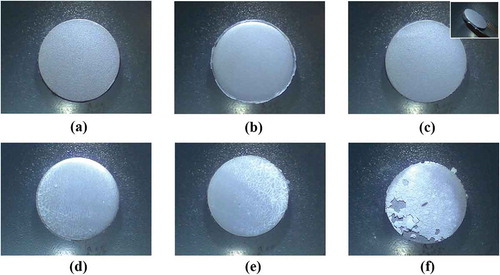
Figure 3. AFM images of (a) dry height (b) phase and (c) hydrated height of 0 wt.% nCHA composite coatings (d) dry height and (e) phase of 5 wt.% nCHA composite coatings (f) dry height (g) phase and (h) hydrated height of 10 wt.% nCHA composite coatings.Note: the colour scale on the images is not consistent.
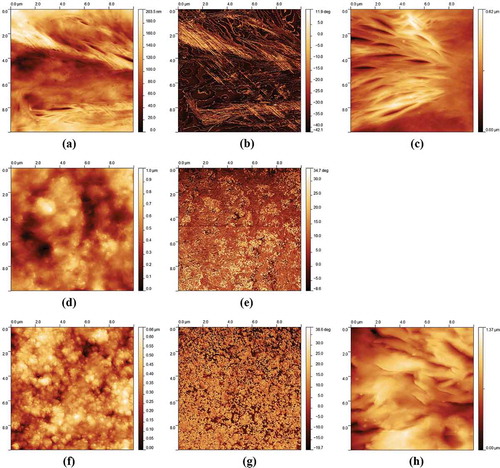
Figure 4. Load-displacement curves of PHEMA/PCL-nCHA composite coatings in (a) dry and (b) wet conditions, the modulus evaluated for the composite coatings in (c) dry and (d) wet conditions.
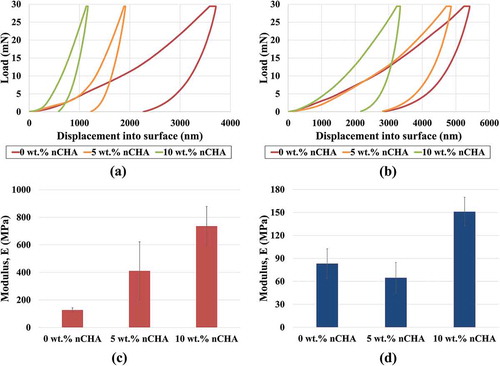
Figure 5. SEM micrographs of primary human osteoblast (HOB) cells on PHEMA/PCL-nCHA composite coating surface with (a) 0 wt.% nCHA (b) 5 wt.% nCHA and (c) 10 wt.% nCHA after 3 days in cell culture, (d) 0 wt.% nCHA (e) 5 wt.% nCHA and (f) 10 wt.% nCHA after 14 days in cell culture.