
Figures & data
Table 1. Chemical composition (wt.%) of the DSS2205 steel.
Figure 1. Flow curves for various deformation conditions. (a) = 0.01 s−1; (b) T ε = 1373 K.
Figure 2. The variation of Q with increasing strain at different strain rate. (a) = 0.01 s−1; (b) = 0.1 s−1; (c) = 1 s−1; (d) = 10 s−1; (e) = 30 s−1.
Figure 3. EBSD image and adjacent grain misorientation distribution of ferrite (Part I). (a)/(b) 0.01 s−1/1323 K, ε = 0.4; (c)/(d) 0.01 s−1/1323 K, ε = 0.8; (e)/(f) 30 s−1/1323 K, ε = 0.8.
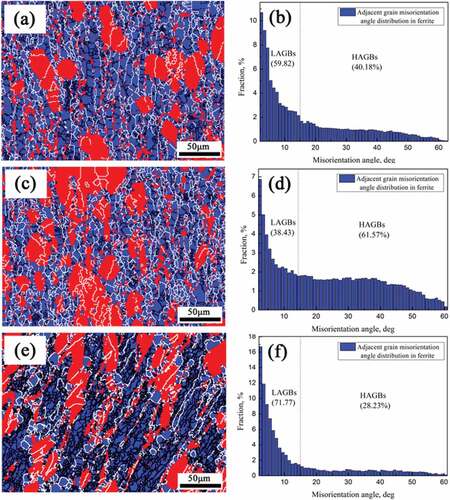
Figure 4. TEM micrographs of the alloy after straining to 0.4 at 1323 K. (a) = 0.01 s−1; (b) ε = 10 s−1.
Figure 5. EBSD image and grain misorientation distribution of ferrite (Part II). (a)/(b) 30 s−1/1423 K, ε = 0.8; (c)/(d) 30 s−1/1223 K, ε = 0.8.
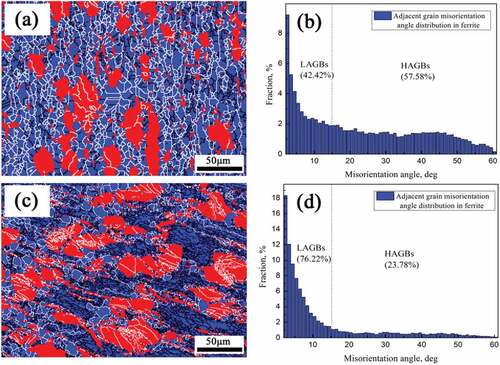
Figure 6. The power dissipation contour map with strain of 0.5 overlapped with LnZ map.
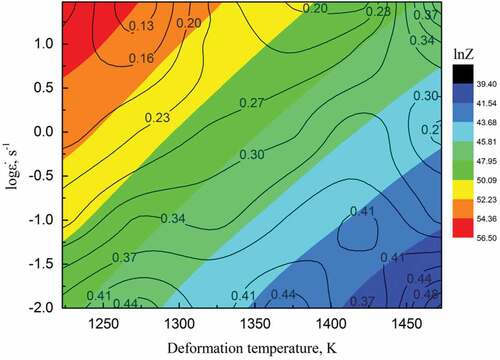
Figure 7. Processing maps plotted by the superposition of power dissipation map and instability map at varying true strain. (a) ε = 0.2; (b) ε = 0.4; (c) ε = 0.5; (d) ε = 0.8.
Figure 8. Microcrack in the alloy deformed at 1323 K/10 s−1.
Data availability statement
The raw/processed data required to reproduce these findings cannot be shared at this time as the data also forms part of an ongoing study.