Figures & data
Table 1. Chemical composition of the 718Plus alloy used in the study (in wt%).
Figure 1. (a) Test specimens for rotational bending fatigue tests at high temperature, (b) High-temperature cantilever rotating bending fatigue testing machine.
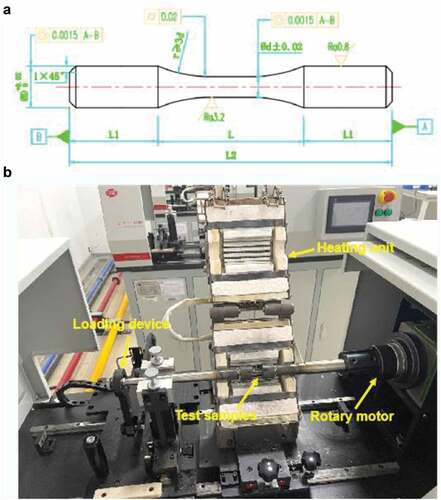
Figure 2. The microstructure of 718Plus alloy was characterised by OM: (a) The overall morphology of the sample grains, (b) Observation diagram of sample grain size.
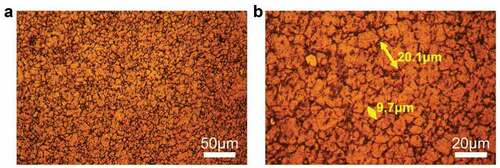
Figure 3. The microstructure of 718Plus alloy was characterised by SEM: (a) Diagram of composition and distribution of each phase of the sample, (b) Partial enlargement of panel A, and (c) EDS spectrum of Spot 1 in Figure B.
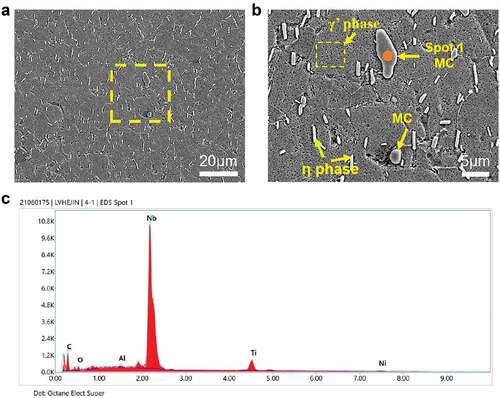
Figure 4. Test the fatigue limit of superalloy by ‘up and down method’: (a) 600°C and (b) 700°C.
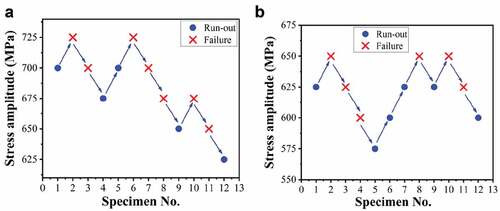
Figure 5. The rotating bending fatigue test data of 718Plus superalloy: (a) Finite and infinite fatigue life data statistics chart at 600°C, and (b) finite and infinite fatigue life data statistics chart at 700°C.
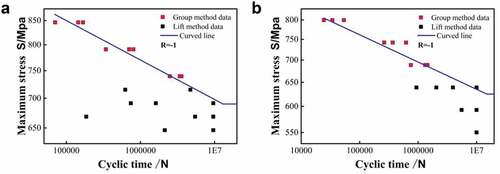
Figure 6. Fracture morphology of rotating bending fatigue specimens in 718Plus superalloy at high temperature.
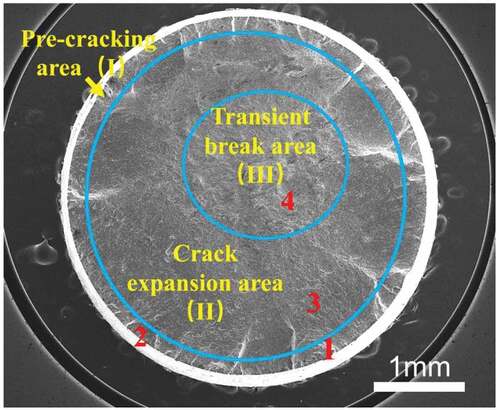
Figure 7. The local fracture morphology of 718Plus high-temperature fatigue fracture, where a, b, c, d correspond to the positions 1, 2, 3, 4 in , respectively.
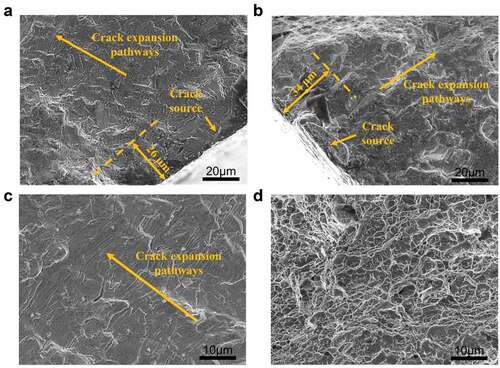
Figure 8. Fatigue fracture morphology of 718Plus superalloy: (a) surface crack initiation caused by inclusions, T = 600°C, S = 750 MPa, N = 2.796 × 10⁶, (b) initiation of subsurface crack initiation, T = 700°C, S = 800 MPa, N = 3.41 × 10⁴, (c) Crack initiation of surface defect initiation, T = 600°C, S = 700 MPa, N = 1.857 × 10⁶.
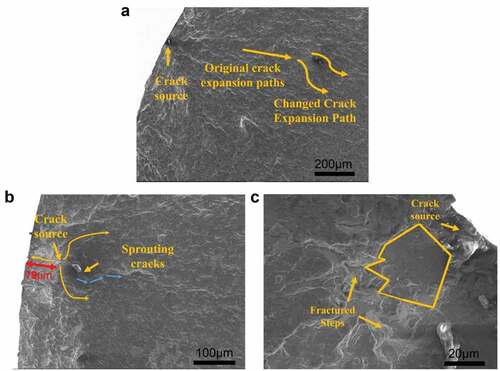
Figure 9. Fatigue streaks and secondary cracks of 718Plus superalloy at different temperatures: (a) T = 600°C, S = 850 MPa, N = 1.91 × 10⁵, (b) T = 700°C, S = 800 MPa, N = 3.14 × 10⁴.
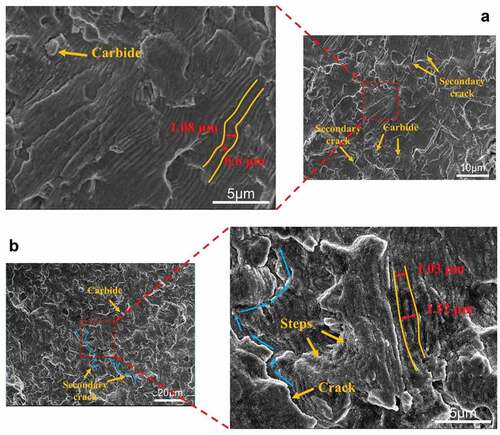
Figure 10. Comparison of fatigue limit of 718Plus superalloy with other alloys at different temperatures.
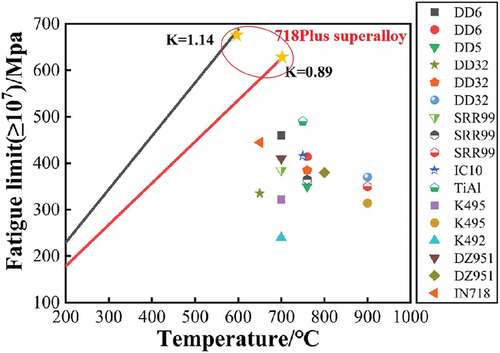
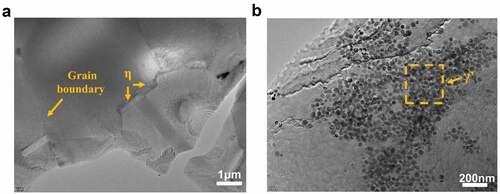
Figure 11. TEM characterisation of η phase and γ’ phase (a) morphology and distribution of η phase, (b) morphology and distribution of γ’ phase.