Figures & data
Figure 1. Physico-chemical characterizations of the C-Li2TiSiO5 nanowires. a) XRD spectrum with Rietveld-refinement. b) Crystal structure. c) FESEM image. d) EDX mapping images. e) HRTEM image (inset: SAED pattern).
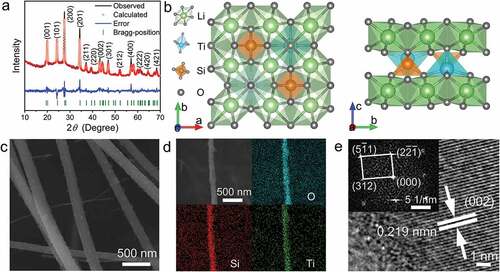
Figure 2. Electrochemical performance of the C-Li2TiSiO5 nanowires. a) CV curves for first four cycles at 0.1 mV s−1, b) first four-cycle GCD curves at 50 mA g−1, c) GCD curves at various current densities, d) rate performance, and e) cyclability of the Li2TiSiO5/Li half cell.
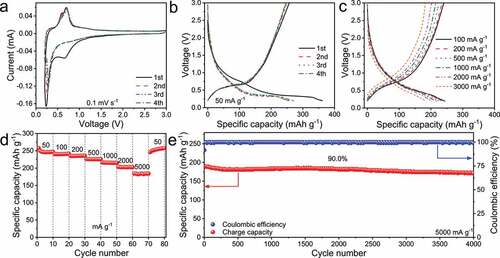
Figure 3. XPS examinations and GITT experiment of the C-Li2TiSiO5 nanowires. Ex-situ Ti-2p XPS spectra of a) pristine, b) lithiated, and c) delithiated states. d) CV curves at various scan rates. e) Calculation of b values. f) DLi variations during lithiation and delithiation.
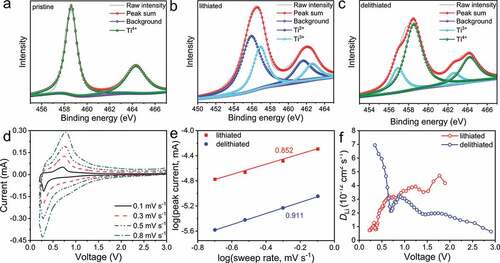
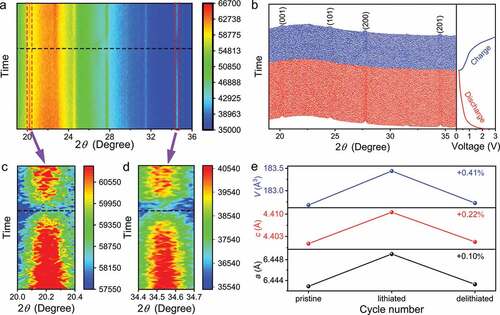
Figure 4. In-situ XRD characterization of the C-Li2TiSiO5 nanowires. a) Contour in-situ XRD spectra and b) original in-situ XRD spectra. Enlarged contour in-situ XRD spectra within c) 20.0–20.4° and d) 34.4–34.7°. e) Variations in lattice constants of Li2TiSiO5.