Figures & data
Figure 1. SEM images of graphene coatings on the Ni (a–c) and Cu (d–f) foams.
Figure 2. Electron spectroscopy of graphene coating on Ni substrate: a) XPS, b) EPES and c) REELS.
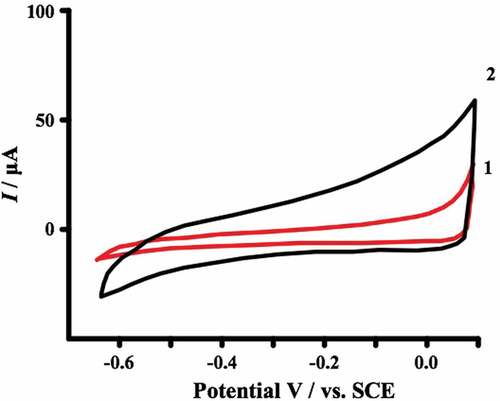
Figure 3. Cyclic voltammetric response of 3DGrNi (1) and 3DGrCu (2) electrodes in comparison to polished GC (3), 1 М solution Na2SO4 + 5 · 10−3 М [Ru(NH3)6]Cl3, ν = 0.01 V/s. 4 – cyclic voltammetric response of 3DGrNi electrode in 1 М solution of Na2SO4.
![Figure 3. Cyclic voltammetric response of 3DGrNi (1) and 3DGrCu (2) electrodes in comparison to polished GC (3), 1 М solution Na2SO4 + 5 · 10−3 М [Ru(NH3)6]Cl3, ν = 0.01 V/s. 4 – cyclic voltammetric response of 3DGrNi electrode in 1 М solution of Na2SO4.](/cms/asset/e6329bad-d489-481a-95fa-028d8956a5ee/ymte_a_2211374_f0003_oc.jpg)
Figure 4. Cyclic voltammetric response at variable scan rates for 3DGrNi (a) and 3DGrCu (b) electrodes. Subplots show dependencies of Iа и Ic vs. ν0.5 (1 М solution Na2SO4 + 5 · 10−3 М [Ru(NH3)6]Cl3).
![Figure 4. Cyclic voltammetric response at variable scan rates for 3DGrNi (a) and 3DGrCu (b) electrodes. Subplots show dependencies of Iа и Ic vs. ν0.5 (1 М solution Na2SO4 + 5 · 10−3 М [Ru(NH3)6]Cl3).](/cms/asset/07d4adf7-3f3d-4a84-8bf9-2a50fb8226ec/ymte_a_2211374_f0004_oc.jpg)
Figure 5. Potential difference ΔEр at different scan rates of 3DGrNi (1) and 3DGrCu (2) electrodes and polished GC (3).
Figure 6. Cyclic voltammogram of 3DGrCu electrode in 1 М Na2SO4 (1) solution with 8 · 10−3 М camphor (2), scan rate – 0.01 V/s.