
Figures & data
Figure 1. Graphical illustration of the chitosan (CS)-coated PLGA nanoparticles encapsulated prednisolone (PDS) and co-encapsulated to poloxamer hydrogel to enhance the treatment of chronic actinic dermatitis (CAD).
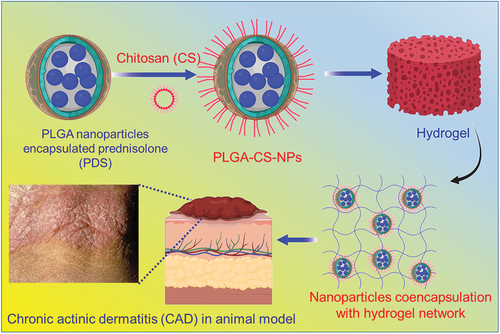
Figure 2. Nanoparticles characterization. a and c) Scanning electron microscopy of PLGA nanoparticles formulations. a) CTL@NPs (Control NPs). c) PLGA nanoparticles loading prednisolone (PDS). b and d) Respective Size distribution analysis by DLS measurement. e-f) Assessment of chitosan-coated onto PLGA-NPs surface determined by zeta potential.
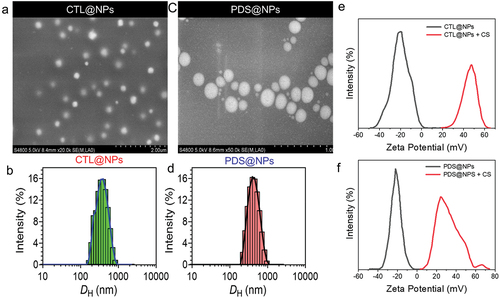
Figure 3. Cytotoxicity with PDS alone, control NPs (Ctl@nps), prednisolone-loaded NPs (Pds@nps), and nonencapsulated PDS (NE@PDS). a-b) primary human keratinocytes (KC) for 24 and 48 h. c and d) primary human Fibroblasts (FB) for 24 and 48 h. Cell proliferation was examined by MTT assay.
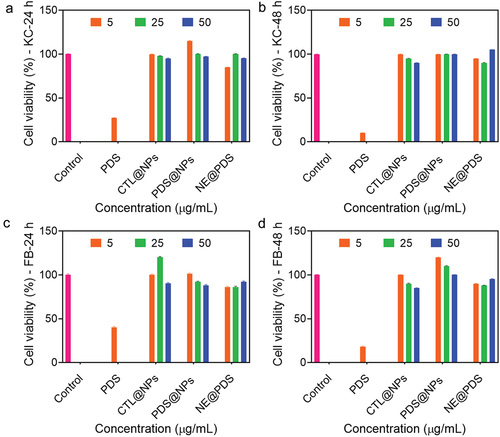
Figure 4. ROS generation with PDS alone, control NPs (Ctl@nps), prednisolone-loaded NPs (Pds@nps), and nonencapsulated PDS (NE@PDS). a) primary human keratinocytes (KC) various concentrations (5, 25, and 50 μg/mL). C and D) primary human Fibroblasts (FB) various concentrations (5, 25, and 50 μg/mL).
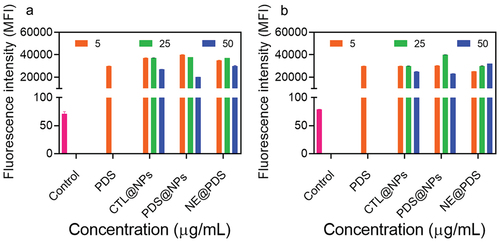
Figure 5. Rheological evaluation of 30% poloxamer hydrogels as a function of temperature (10–50°C). a) Control hydrogel (P407), b) hydrogel containing PDS (P407-PDS), c) hydrogel containing PLGA-NPs (P407-CTL@NPs), d) hydrogel containing PDS-loaded PLGA-NPs (P407-PDS@NPs).
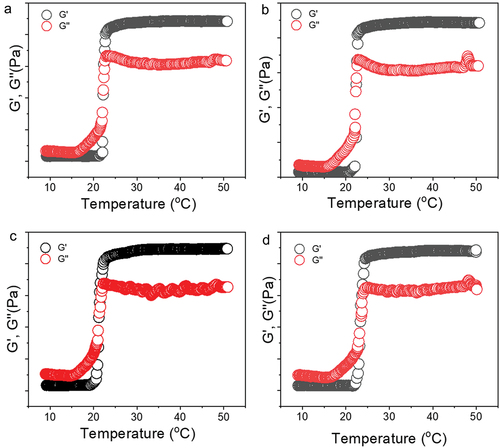
Figure 6. Viscosity evaluation of 30% poloxamer hydrogels as a function of temperature (10–50°C). a) Control hydrogel (P407), b) hydrogel containing PDS (P407-PDS), c) hydrogel containing PLGA-NPs (P407-CTL@NPs), d) hydrogel containing PDS-loaded PLGA-NPs (P407-PDS@NPs).
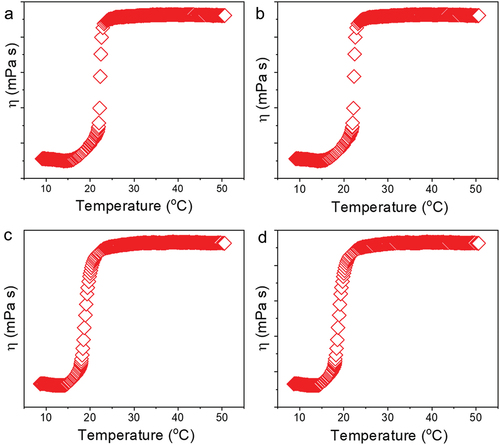
Figure 7. Rheological evaluation of 30% poloxamer hydrogels as a function of frequency (0.1–10 Hz). a) Control hydrogel (P407), b) hydrogel containing PDS (P407-PDS), c) hydrogel containing PLGA-NPs (P407-CTL@NPs), d) hydrogel containing PDS-loaded PLGA-NPs (P407-PDS@NPs).
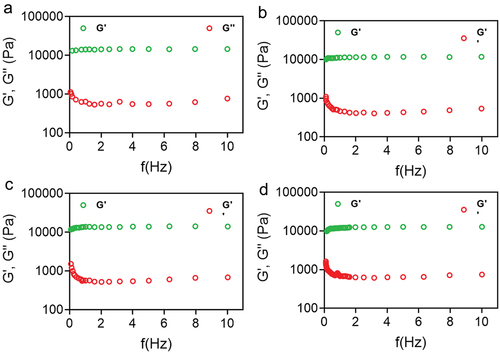
Figure 8. Rheological evaluation of 30% poloxamer hydrogels as a function of frequency (0.1–10 Hz). a) Control hydrogel (P407), b) hydrogel containing PDS (P407-PDS), c) hydrogel containing PLGA-NPs (P407-CTL@NPs), d) hydrogel containing PDS-loaded PLGA-NPs (P407-PDS@NPs).
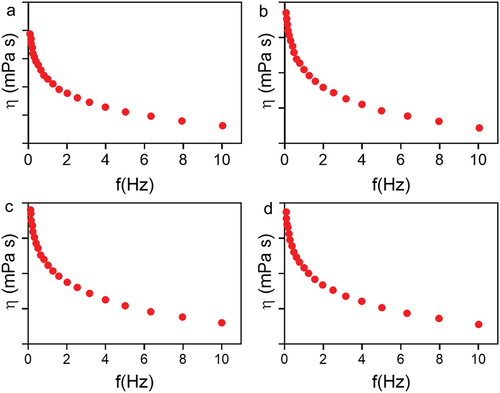
Figure 9. Flow curvature changes the shear rate as a function of the shear stress of poloxamer 407 hydrogel at 32.5°C. a) Control hydrogel (P407), b) hydrogel containing PDS (P407-PDS), c) hydrogel containing PLGA-NPs (P407-CTL@NPs), d) hydrogel containing PDS-loaded PLGA-NPs (P407-PDS@NPs). e) Drug release of PDS from the PLGA-NPs and NPs incorporated into hydrogels.
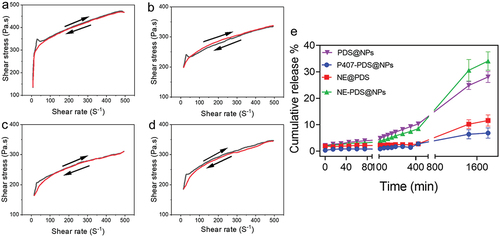
Figure 10. PDS skin penetration assay. a) Quantity of PDS measured in the epidermis and (b-e) dermis after 6 h of topical function of various formulations.
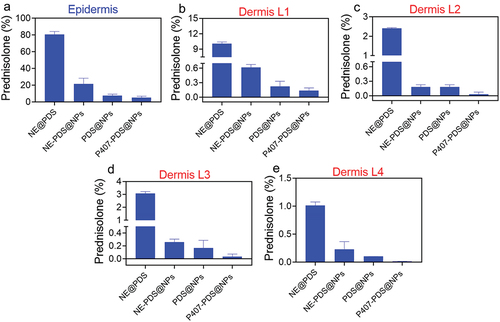
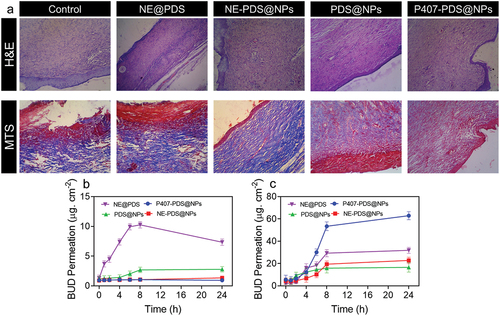
Figure 11. H&E staining and MTS staining of skin damaged sites after treatment with control, NE@PDS, P407-CTL@NPs, PDS@NPs, and NE-PDS@NPs. b-c) PDS permeations from the NPs and PLGA-NPs are incorporated into hydrogels. The permeation assay was achieved using the vertical diffusion cell b) Full-width ear skin and c) damaged ear skin.
Data availability statement
All data generated or analysed during this study are included in this submitted article. The raw data shall be made available upon request to the corresponding author.