Figures & data
Figure 1. EBSD images of experimental alloy homogenized at 1273K for 24 h.
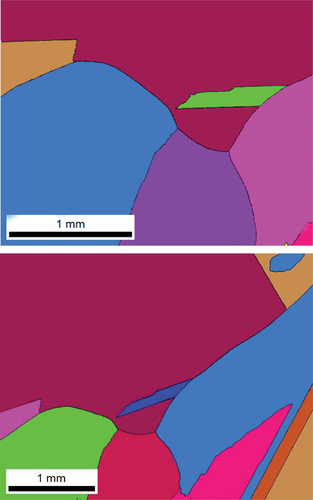
Figure 2. An example of EDS elemental mapping showing stronger GB segregation of Cr, weaker segregation of Mn and depletion of Fe, Co and Ni at the GBs.
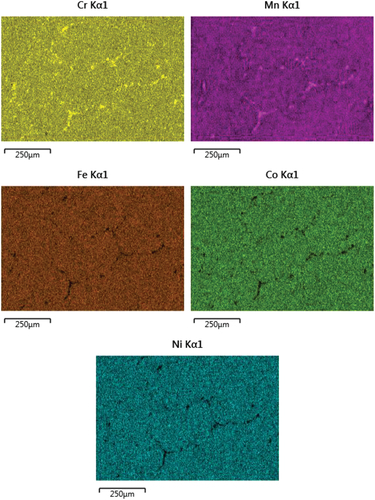
Figure 3. An example of EDS point analysis at the GB showing stronger segregation of Cr and weaker segregation of Mn at the GBs and depletion of Fe, Co and Ni at the GBs in the alloy.
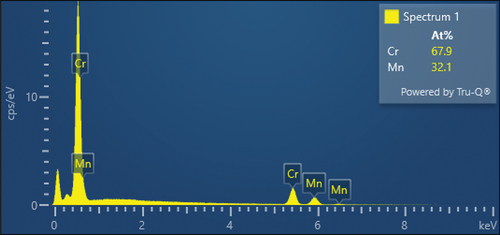
Figure 4. Cr/Mn atomic% ratio as a function of temperature demonstrating stronger GB segregation of Cr and weaker GB segregation of Mn. Bars indicate the range over which the values were observed.