
Figures & data
Table 1. Preliminary phytochemical constituent of Tinospora cordifolia leaf extracts.
Figure 1. Total phenolic and total flavonoid content in T. cordifolia leaf extract.
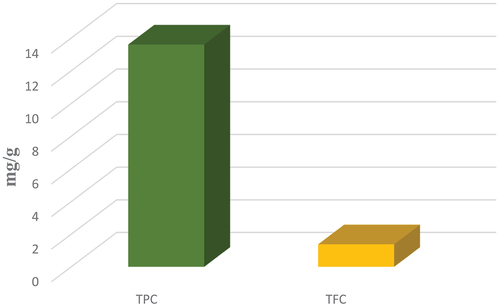
Table 2. Quantitative analysis of phytochemical constituents of T. cordifolia leaf extract.
Figure 2. Free radical-scavenging activity of T. cordifolia leaf Extract.
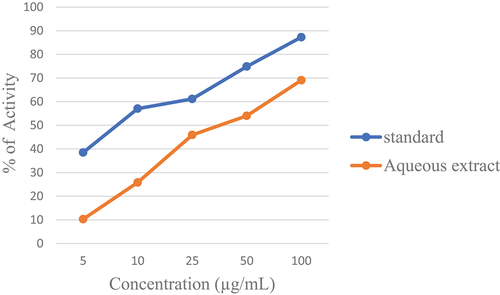
Table 3. Free radical-scavenging activity of T. cordifolia leaf extract at different concentrations using DPPH method.
Figure 3. Reducing power of T. cordifolia leaf extract.
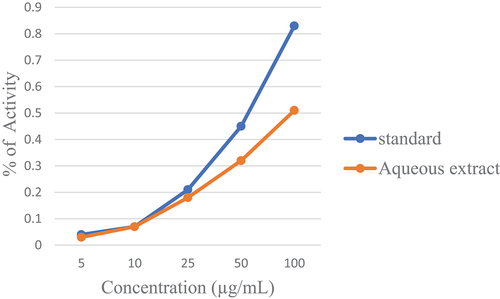
Table 4. Reducing capacity of T. cordifolia leaf extract at different concentrations.
Figure 4. UV-Vis spectra of Cu NPs synthesized by T. cordifolia leaves extract after reaction over and after a period of 1 week.
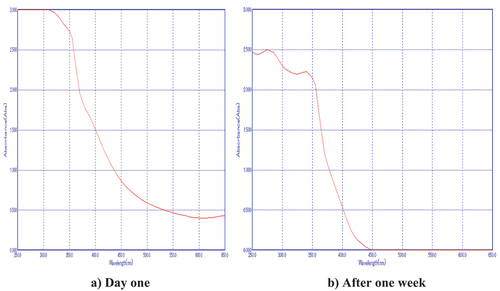
Figure 5. FT-IR spectrum of the synthesized Cu NPs.
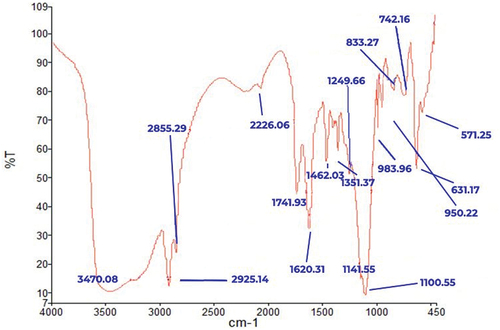
Figure 6. XRD of copper nanoparticles.
Figure 7. SEM-EDAX of copper nanoparticles.
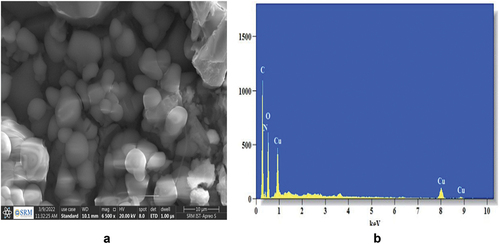
Figure 8. Transmission electron microscopy image of Biosynthesised Cu NPs.
Figure 9. Antimicrobial activity of bio-Cu NPs.
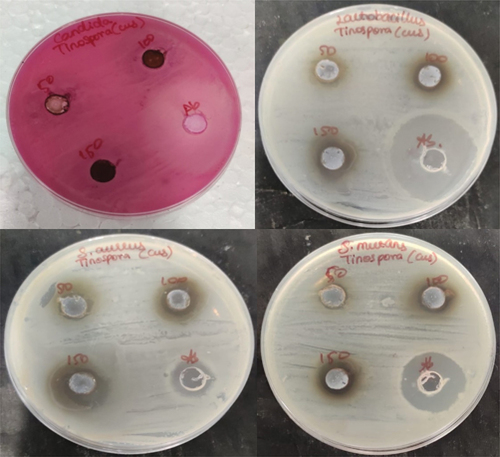
Table 5. Zone of inhibition of different bacterial and fungal pathogens with respect to bio-Cu NPs volumes.
Figure 10. Anti-inflammatory activity of bio-synthesized Cu NPs.
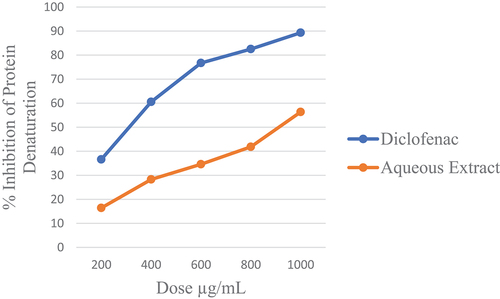
Table 6. Anti-inflammatory activity of bio-synthesized Cu NPs.
Data availability statement
The authors confirm that the data supporting the findings of this study are available within the article.