
Figures & data
Figure 1. Schematic diagram of heat treatment.
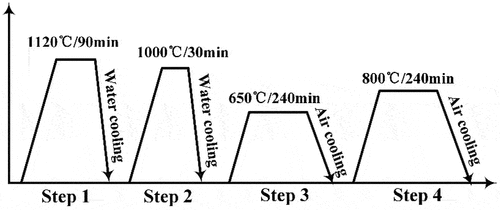
Table 1. The chemical composition of the fe-ni-based superalloy (wt.%).
Figure 2. SEM images showing the morphology of (a) carbides and (b) γ′ precipitates in the matrix.
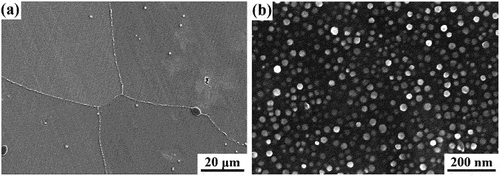
Figure 3. Overall strain-creep (black line) and strain rate-creep time (red line) curves of the fe-ni-based superalloy under the creep conditions of (a) 750°C/130 MPa and (b) 700°C/200 MPa.
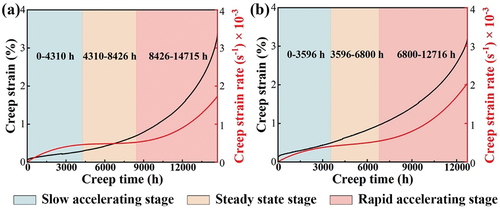
Figure 4. Morphology of the carbides after creep test under the conditions of (a–c) 750°C/130 MPa and (d-f) 700°C/200 MPa.
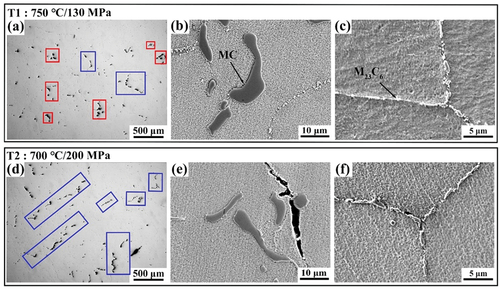
Figure 5. The elemental mapping images of TiC and Cr23C6 carbides in the experimental alloy under the creep condition of 700°C/200 MPa.
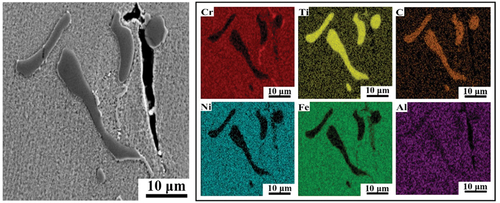
Figure 6. SEM images showing the morphology of γ′ precipitates under the creep condition of (a) 750°C/130 MPa and (b) 700°C/200 MPa. (c) TEM bright-field image and corresponding (d) EDS elemental analysis results of the experimental alloy under the creep condition of 700°C/200 MPa.
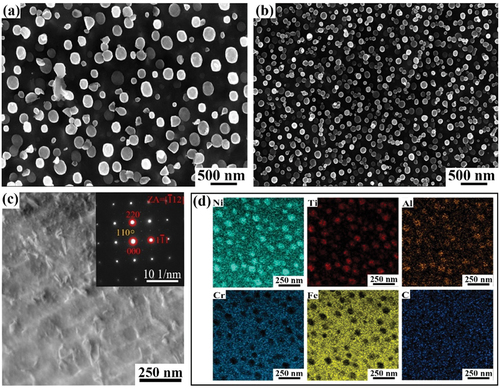
Figure 7. SEM and EDS mapping images of PFZs/DCZs in samples after creep at (a, b) 750°C/130 MPa and (c, d) 700°C/200 MPa. (e) elemental mapping of the coarse precipitates in the sample crept at 700°C/200 MPa.
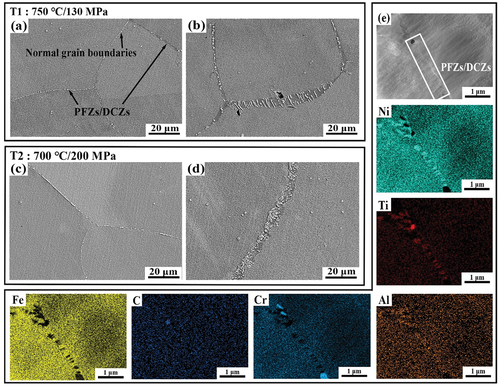
Figure 8. SEM images showing the fracture morphology of the alloy under the creep conditions of (a, b) 750°C/130 MPa and (c, d) 700°C/200 MPa.
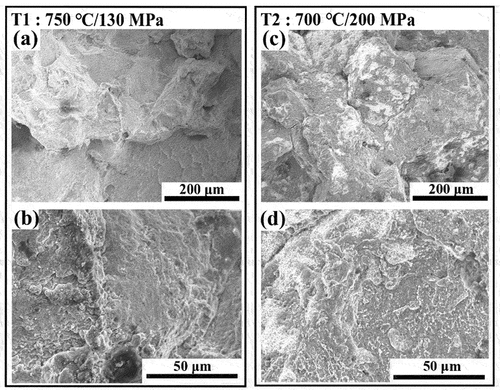
Figure 9. EBSD analysis results of the alloy after creep at of 750°C/130 MPa and 700°C/200 MPa. (a, d) inverse pole figure (IPF), (b, e) kernel average misorientation (KAM) figure (red lines: low angle grain boundary (2°–15°); black lines: high angle grain boundary (>15°)), (c, f) coincidence site lattice (CSL) boundary figure, (g) strains calculated by KAM results, (h) the proportion of various coincidence site lattice (CSL) grain boundaries.
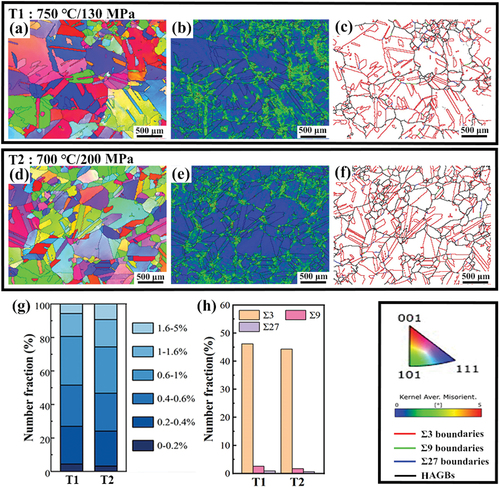
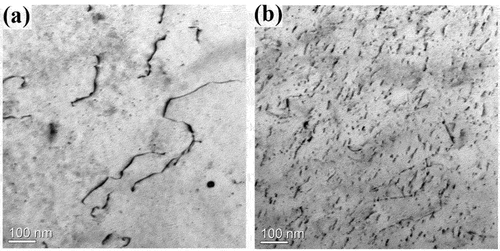
Figure 10. TEM bright-field images showing the interaction between dislocations and γ′ particles when crept at (a) 750°C/130 MPa and (b) 700°C/200 MPa.
Data availability statement
The raw/processed data required to reproduce these findings cannot be shared at this time as the data also forms part of an ongoing study