Figures & data
Table 1. HLB values of composite surfactants prepared by various ratios of span/Tween.
Figure 1. DLS testing results of different PO/SA nanoemulsions illustrating the effects of (a) surfactant HLB value; (b) emulsification temperature; (c) PO/oil phase ratio; (d) oil phase/emulsion ratio on the mean droplet size and PDI.
Table 2. Factors and levels of the response surface methodology.
Table 3. Analysis of variance for regression model.
Table 4. Model fit summary for quadratic model statistics.
Table 5. Groups of PO/SA nanoemulsion set for appearance and stability check.
Figure 2. (a) appearance of four groups of PO/SA nanoemulsions, (b) mean droplet size of different nanoemulsions at day0 (6h) and day7 (174h), and (c) PDI of different nanoemulsions at day0 (6h) and day7 (174h).
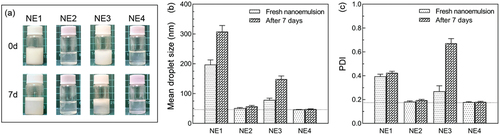
Figure 3. Optical microscopy images of PO/SA microcapsules prepared by different pulse durations of (a)100, (b) 80, (c) 60, (d) 40, and (e) 20 ms.
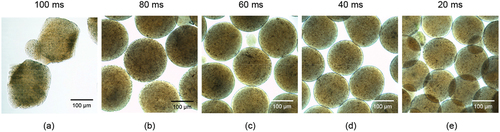
Figure 4. Optical microscopy and FESEM images of pure sodium alginate microcapsules (a) and PO/SA microcapsules with different shell/core ratios of (b) 2 (S/C-2), (c) 1 (S/C-1), and (d) 0.5 (S/C-0.5).
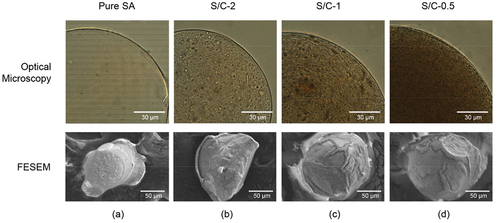
Figure 5. (a) size and (b) shape distribution of PO/SA microcapsules fabricated with different pulse durations and shell/core ratios (***: p < 0.001, **: p < 0.05, *: p < 0.01).
Figure 6. The effect of PO contents on the UV-Vis absorbance: (a) the UV-Vis spectra of peppermint oil, (b) the relationship of UV-Vis absorbance with the concentration of core contents of PO/SA microcapsules in CaCl2, and (c) the encapsulation efficiency of PO/SA microcapsules fabricated with different parameters (***: p < 0.001, **: p < 0.05, *: p < 0.01).
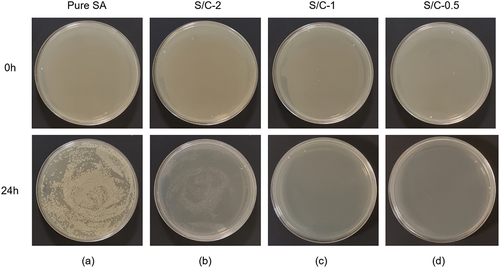
Figure 7. Killing experiments on E. coli at 0h and 24h for (a) pure SA microcapsules, (b) S/C-2, (c) S/C-1, and (d)S/C-0.5 PO/SA microcapsules.