Figures & data
Figure 1. Schematic picture of the samples preparation for the measuring.
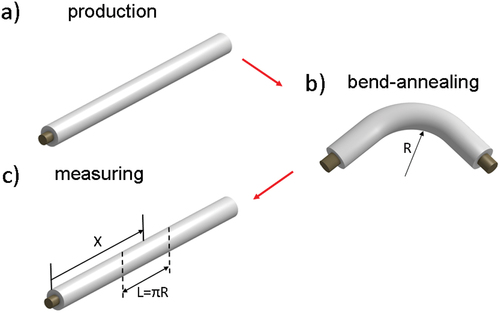
Figure 2. Fluxmetric hysteresis loops obtained in the samples 1 () and sample 2 (). ) demonstrate the hysteresis loops corresponding to the central part of the samples 1 and 2. shows the hysteresis loops obtained in high magnetic field (sample 1) in points corresponding to X=10 mm and 50 mm. shows the hysteresis loops obtained in samples 1 and 2 in points corresponding to X=50 mm.
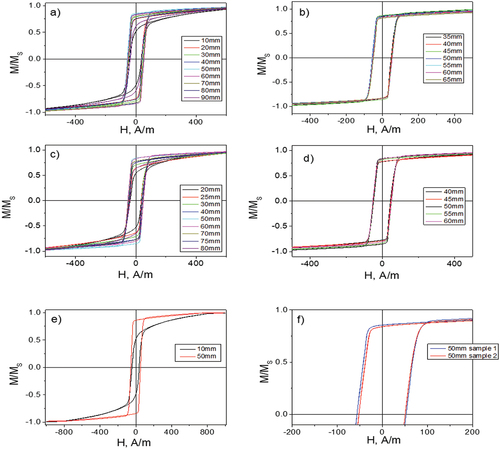
Figure 3. Images of the surface magnetic structure corresponding to different parts of the sample 1 (a, b) and sample 2 (c, d).
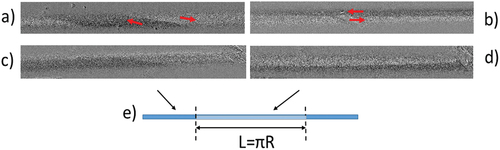
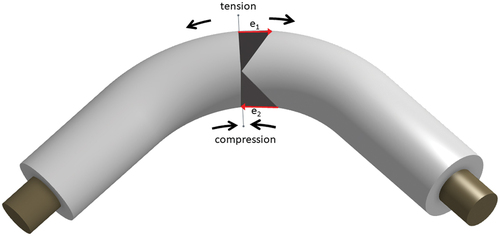
Figure 4. Distribution of the mechanical stress in bended microwire.