Figures & data
Figure 1. SEM microstructures of Fe-Mn-al dual-phase (a) HR; SST at 1000°C for different durations: (b) 15 minutes, (c) 60 minutes, and (d) 240 minutes.
Figure 2. (a) XRD patterns of the experimental steel HR and after different durations of solid solution treatment (γ: austenite, δ: δ-ferrite) and (b) the changes in mass fractions of each phase with solid solution time.
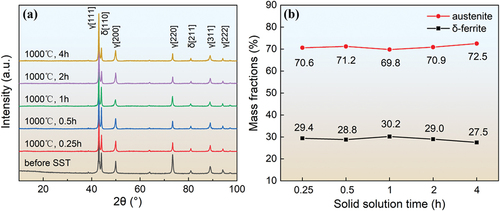
Figure 3. EBSD microstructure and grain boundary angle analysis of the experimental steel after solid solution treatment at 1000°C for different durations: (a) 15 minutes, (b) 60 minutes, (c) 240 minutes, and (d) changes in the average grain size of austenite and δ-ferrite, as well as the proportion of grain boundaries, concerning solid solution time.
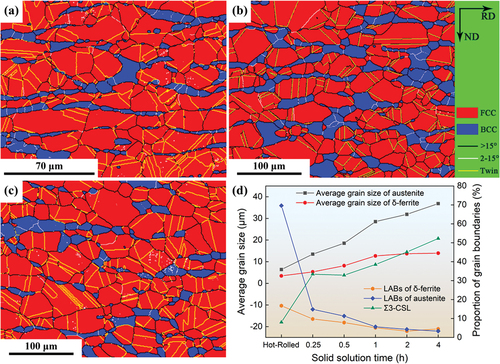
Figure 4. (a) elemental distribution and (b) microhardness in austenite and δ-ferrite as a function of solid solution time.
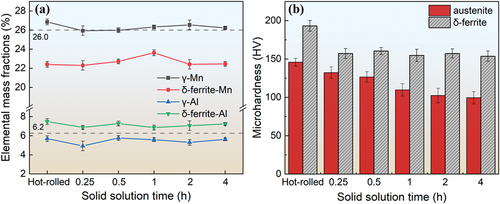
Table 1. Fe-Mn-al dual-phase elemental distribution and microhardness in the two-phase microstructure before and after various solid solution treatments.
Figure 5. The variation of (a) tensile strength and yield strength, (b) ETF and PSE, and (c) impact toughness at 25°C as a function of solid solution time in Fe-Mn-al dual-phase.
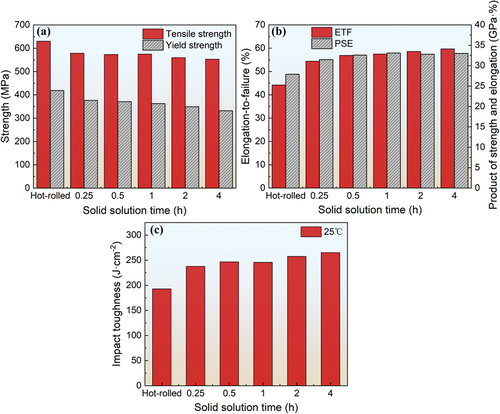
Table 2. Mechanical properties of Fe-Mn-al dual-phase before and after various solid solution treatments.
Figure 6. (a) engineering stress-strain curves under different deformation levels. (b) XRD patterns of microstructures under different deformation levels (γ: austenite, δ: δ-ferrite).
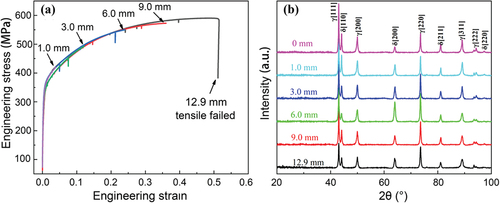
Figure 7. SEM microstructures of Fe-Mn-al dual-phase steel at different levels of deformation: (a) un-deformed; (b) 1.0 mm; (c) 3.0 mm; (d) 6.0 mm; (e) 9.0 mm; (f) 12.9 mm (failed).
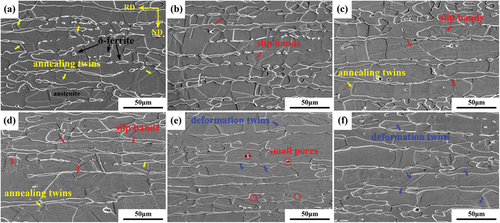
Figure 8. EBSD maps of Fe-Mn-al dual-phase steel at different levels of deformation: (a) un-deformed; (b) 1.0 mm; (c) 3.0 mm; (d) 6.0 mm; (e) 9.0 mm; (f) 12.9 mm (failed).
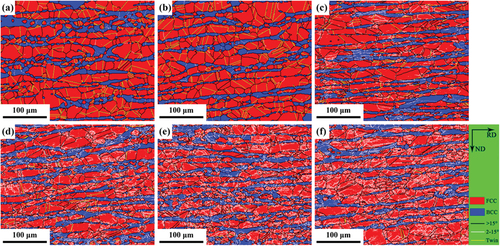
Figure 9. Grain boundary angle distribution of Fe-Mn-al dual-phase steel at different levels of deformation: (a) un-deformed; (b) 1.0 mm; (c) 3.0 mm; (d) 6.0 mm; (e) 9.0 mm; (f) 12.9 mm (failed); (g) relationship between the distribution frequencies of different grain boundaries and the deformation levels; (h) distribution of low-angle boundaries (LAGBs) in austenite and δ-ferrite; (i) microhardness variation of austenite and δ-ferrite with different deformation levels.
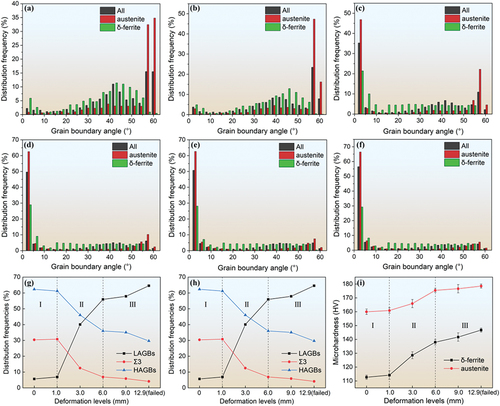
Figure 10. TEM morphology of steel microstructure before tensile deformation experiments (a) mobile dislocations in δ-ferrite; (b) annealing twins in austenite.
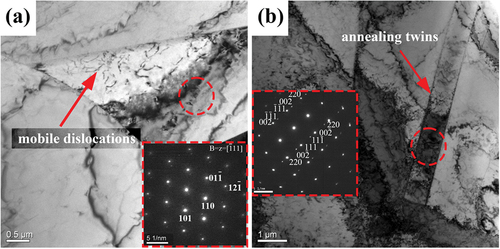
Figure 11. TEM morphology at a deformation level of 1.0mm (a) dislocation nodes in δ-ferrite; (b) ordered dislocation bundles in austenite.
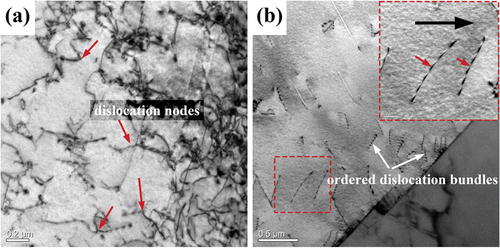
Figure 12. TEM morphology at a deformation level of 3.0mm: (a) dislocation entanglement in δ-ferrite. (b) extended dislocations in austenite. (c) dislocation network. (d) face-angle dislocations. (e) high-density dislocations in annealing twins. (f) diffraction pattern of annealing twins in (e).
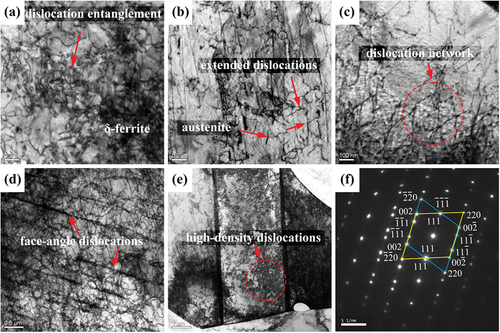
Figure 13. Formation process schematic of (a) dislocation network (b) face-angle dislocation in austenite.
Figure 14. TEM morphology at a deformation level of 6.0mm: (a) dislocation cells in δ-ferrite; (b) Taylor lattice in austenite; (c) high-density dislocation walls at the austenite/δ-ferrite phase boundary; (d) disappearance of annealing twin boundaries. TEM morphology at a deformation level of 9.0mm: (e) high-density dislocation blocks in δ-ferrite; (f) microbands in austenite; (g) microbands crossing annealing twin boundaries; (h) deformation twins in austenite.
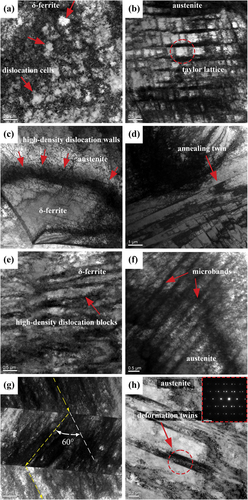
Figure 15. TEM morphology at a deformation level of 12.9 mm: (a) high-density dislocation blocks in δ-ferrite. (b) microband junctions in austenite. (c) microbands passing through δ-ferrite grains. (d) deformation twins in austenite.
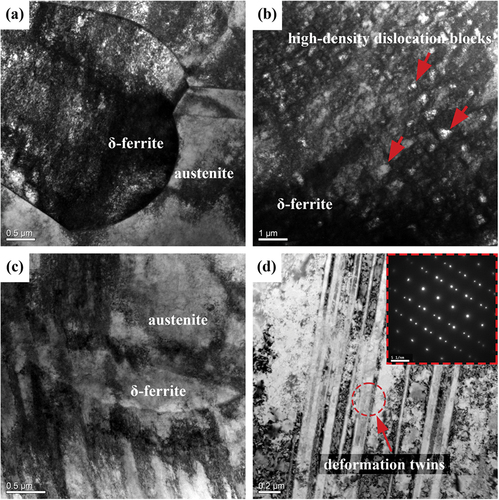
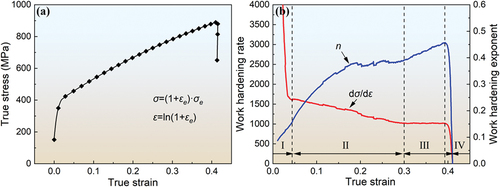
Figure 16. (a) tensile true stress-strain curve. (b) relationship between strain and work hardening rate, as well as work hardening exponent, of Fe-Mn-al dual-phase steel.