
Figures & data
Scheme 1. The schematic representation of the present investigation established that Rutin-Aucubin loaded Chitosan NPs inducing sustained drug release and apoptosis of cancer cells.
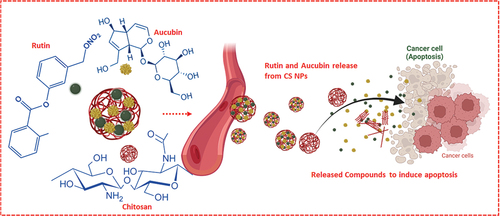
Figure 1. Characterization of nanocomposites (a) TEM image of chitosan rutin-aucubin (b) size distribution spectrum of chitosan rutin-aucubin (c) Zeta potential of chitosan rutin-aucubin.
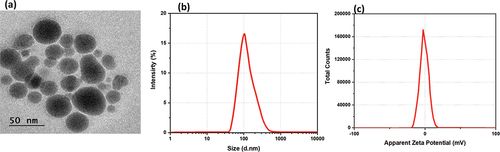
Figure 2. In vitro release kinetics of chitosan-rutin-aucubin.
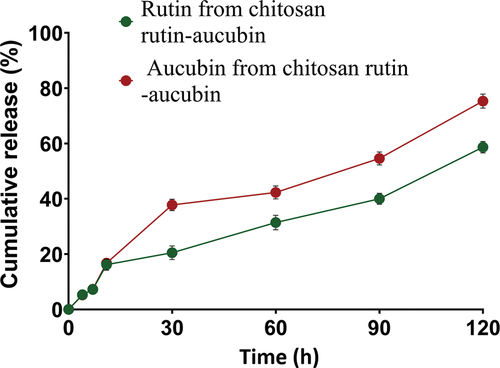
Figure 3. Cytocompatibility of chitosan, chitosan-rutin, chitosan rutin-aucubin in L929 cells at different incubation hours (0 h, 24 h and 48 h); scale bar = 100 µm.
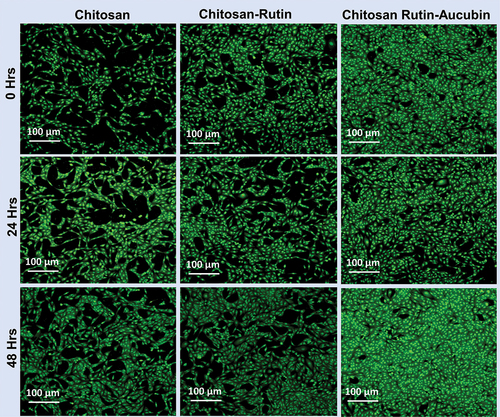
Figure 4. Cell viability MTT study in U87 glioma cells treated with chitosan rutin, chitosan aucubin and chitosan rutin-aucubin at various concentrations for 24, 48 and 72 h. The data are indicative of at least three individual studies and are shown as mean ± sem. ANOVA and Student’s t-test are used; *p < 0.05, **p < 0.01, ***p < 0.001.
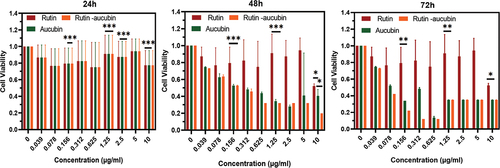
Figure 5. Cell viability study in U87 glioma cells AO/EB-stained (a) control (b) chitosan (c) chitosan-rutin (d) chitosan-aucubin (e) chitosan rutin-aucubin; scale bar = 100 µm.
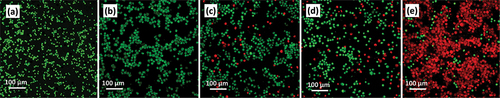
Figure 6. Flow cytometry images of apoptosis study in U87 cells with chitosan rutin, chitosan aucubin and chitosan rutin-aucubin at various concentrations for 48 h.
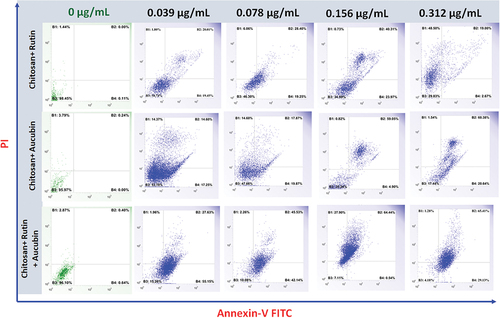
Figure 7. Apoptosis study in U87 cells with chitosan rutin, chitosan aucubin and chitosan rutin-aucubin at various concentrations for 48 h. The data are indicative of at least three individual studies and are shown as mean ± sem. ANOVA and Student’s t-test are used; *p < 0.05, **p < 0.01, ***p < 0.001.
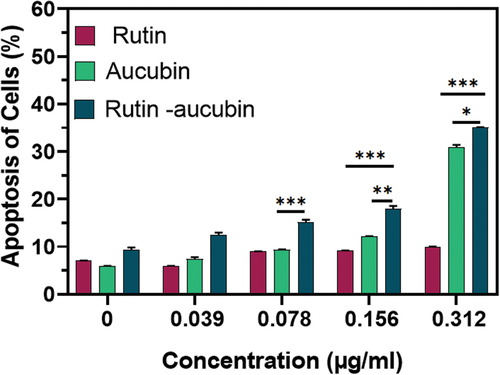
Figure 8. Changes in mitochondrial membrane potential (ΔΨm) of chitosan rutin-aucubin.
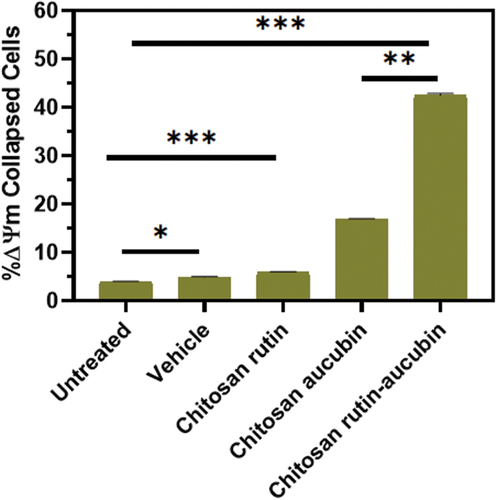
Figure 9. In vitro wound scratch assay for chitosan rutin-aucubin at different incubation time (0 h, 6 h, 12 h, 24 h & 48 h); scale bar = 100 µm.
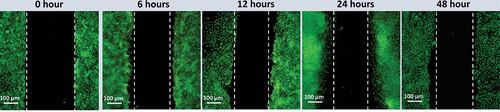
Figure 10. Cell uptake fluorescent microscopy study of RBITC-labelled NP (a, c, e) and ANG-NP (b, d, f) at different time intervals. A & b 30 min, c & d 60 min, e & f 120 min. Red: RBITC; scale bar = 100 µm.
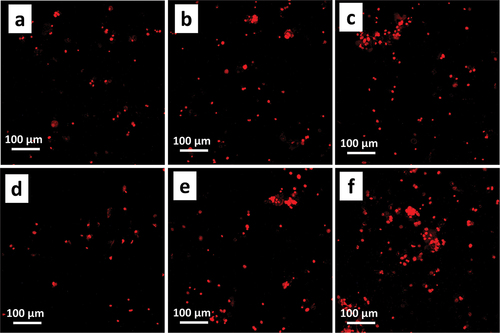
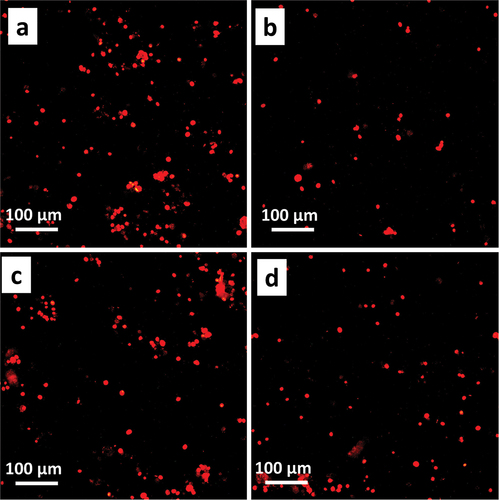
Figure 11. Cell uptake fluorescent microscopy study of RBITC-labelled NP after 120 min. A &b ANG-NP and ANG-NP at 4°C, c & d 200 mg/ml free angiopep-2 ANG-NP and aprotinin. Red: RBITC; scale bar = 100 µm.
Data availability statement
The data used to support the findings of this study are available from the corresponding author upon request.