Figures & data
Table 1. Composition of the medicated gelling layer of the patches (surface area = 24.62 cm2).
Figure 1. FTIR diagrams of I) IONPs, II) St-IONPs, and III) DOX@St-IONPs.
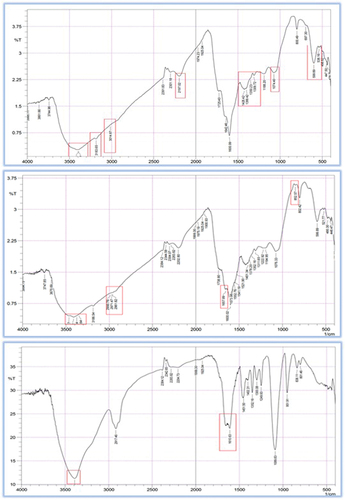
Figure 2. X-ray diffraction of St-IONPs and DOX@St-IONPs.
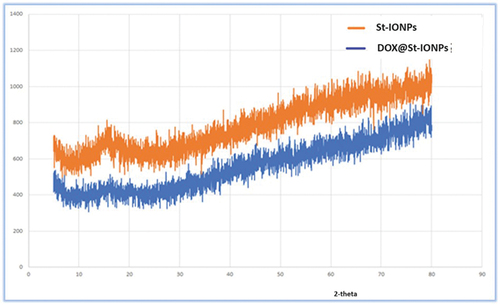
Figure 3. %cancer cell viability using different treatments including plant extract, IONPs, St-IONPs, DOX@St-IONPs, DOX and FeCl3.
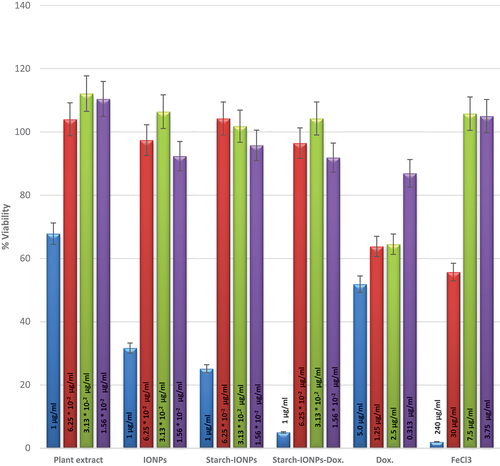
Table 2. Physicochemical properties of M1-M4 patches.
Figure 4. The cumulative amount of DOX diffused per unit surface area across cellulose membrane (surface area = 1.77 cm2) from different patches (M1-M4).
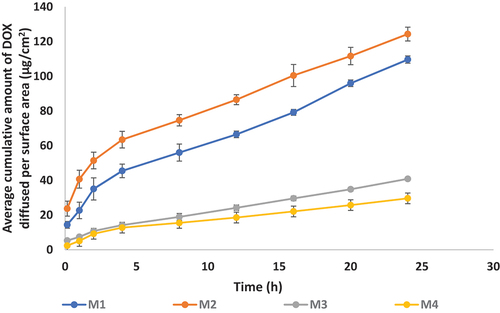
Table 3. The diffusion parameters (flux and permeability) of DOX across cellulose membrane.
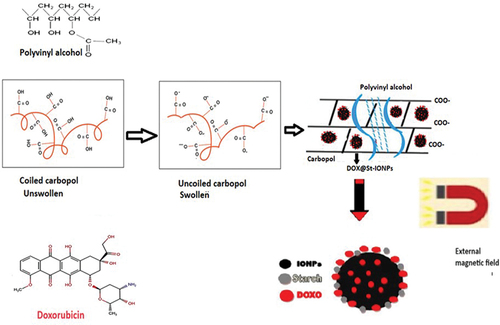
Figure 5. The postulated mechanism for controlled drug release from the patch.