
Figures & data
Figure 1. UV-Vis spectral changes of the drug solution during loading onto Al-doped ZnO nanoparticles.
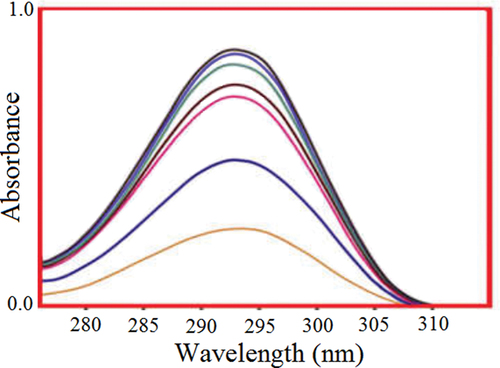
Figure 2. FT-IR spectrum of (a) Al-ZnO, (b) lenalidomide, and (c)Al/ZnO-lenalidomide.
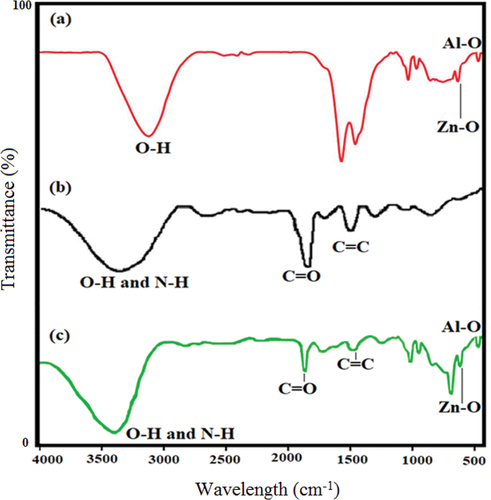
Figure 3. XPS pattern of the synthesized Al-ZnO nanoparticles. (a) survey spectrum; (b) Zn 2p region; (c) O1s region; and (d) Al2p region of the survey spectrum.
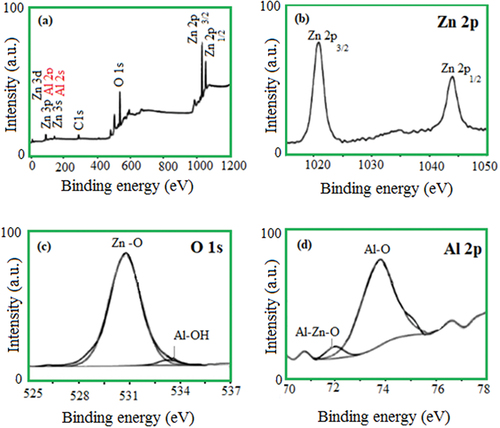
Figure 4. SEM pictures of (a) ZnO, (b) Al-ZnO, and (c) TEM image of Al-ZnO.
Figure 5. XRD pattern of Al-ZnO.
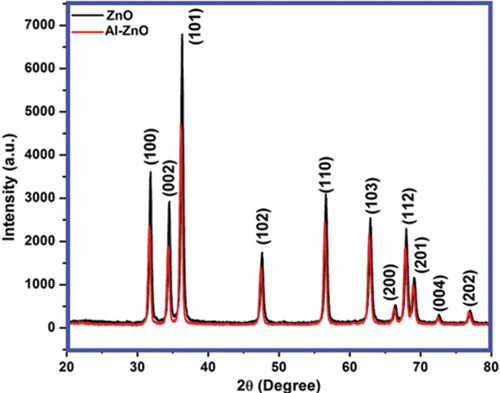
Figure 6. EDS pattern of (a) ZnO and (b) Al-ZnO.
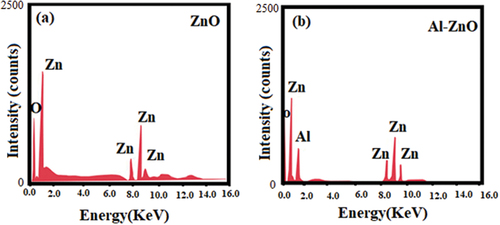
Figure 7. Absorbance spectra for ZnO and Al-ZnO (a). The Tauc plots for ZnO and Al-ZnO (b).
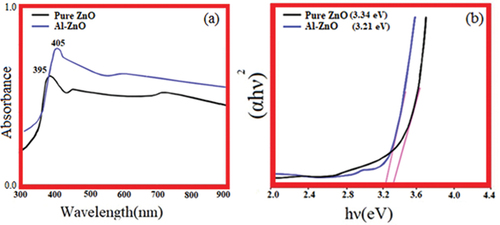
Figure 8. The in vitro release of lenalidomide at pH 6.2 and 7.4.
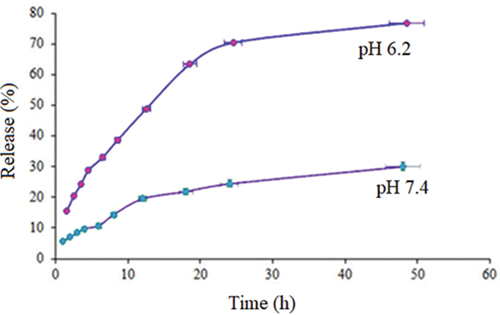
Figure 9. Three distinct pathways in the interactions of Al/ZnO with lenalidomide.
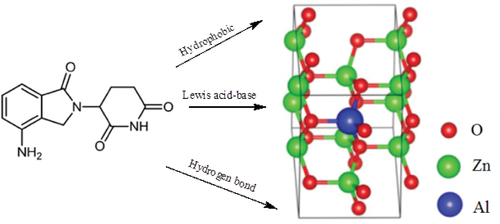
Figure 10. Cell viability of U266 against free drug and drug loaded Al-ZnO.
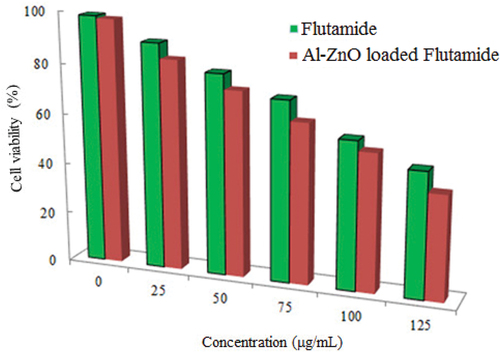
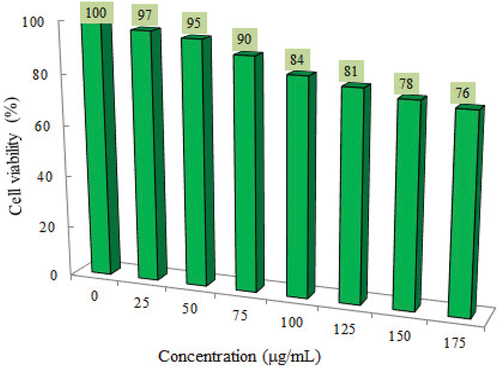
Figure 11. Cell-viability of L929 normal cells vs Al-ZnO concentration.
Data availability statement
The data that support the findings of this study are available from the corresponding author upon reasonable request.