Figures & data
Figure 1. (a) EBSD IPF, (b) EBSD BC, and (c) EBSD KAM mappings of the as-cast alloy.
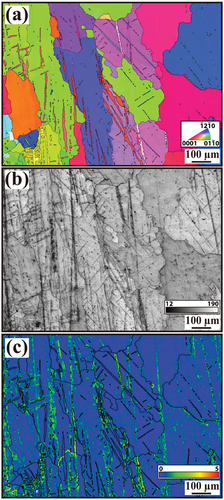
Figure 2. (a, d) EBSD IPF, (b, e) EBSD BC, and (c, f) EBSD KAM mappings of the annealing alloy.
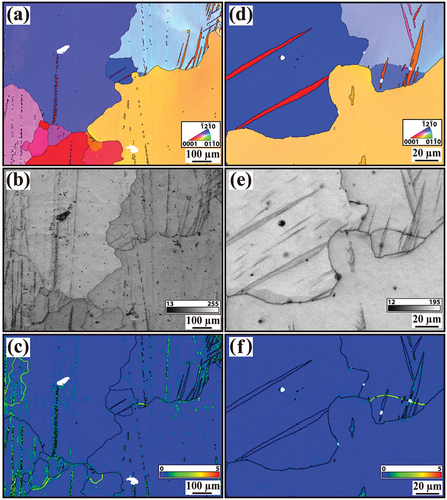
Figure 3. (a, d) EBSD IPF, (b, e) EBSD BC, and (c, f) EBSD KAM mappings of the first-round deformed samples.
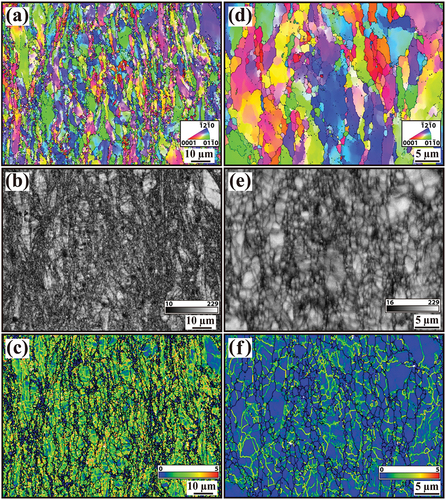
Figure 4. (a, d) EBSD IPF, (b, e) EBSD BC, and (c, f) EBSD KAM mappings of the second round of deformed samples.
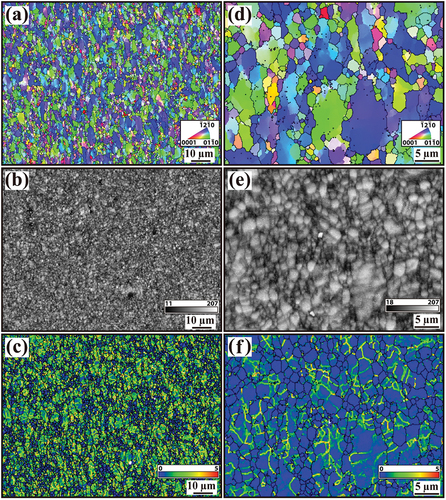
Figure 5. The grain size distribution charts show the grain structures of (a) the as-cast, (b) the annealed, (c) the first-round deformed, and (d) the second-round deformed samples.
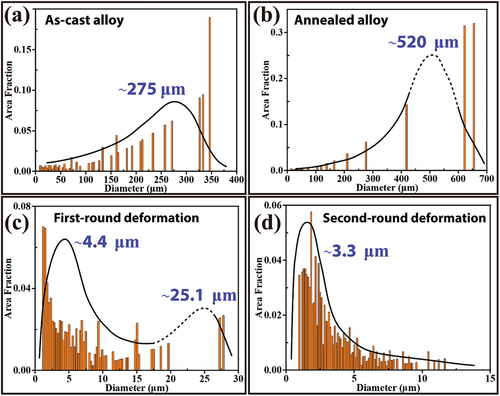
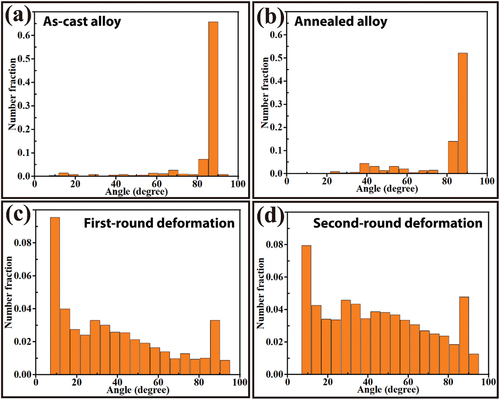
Figure 6. The misorientation angle distribution charts of (a) as-cast, (b) annealed, (c) first-round deformed, and (d) second-round deformed samples.