Figures & data
Figure 1. Synthesis route of CHP1, CHP2 and CHP3.
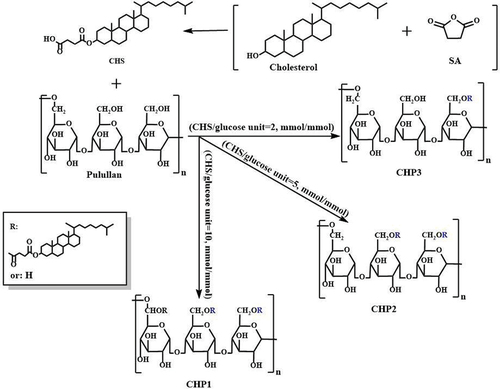
Figure 2. 1H NMR spectra of pullulan and three types of CHP nanoparticles.
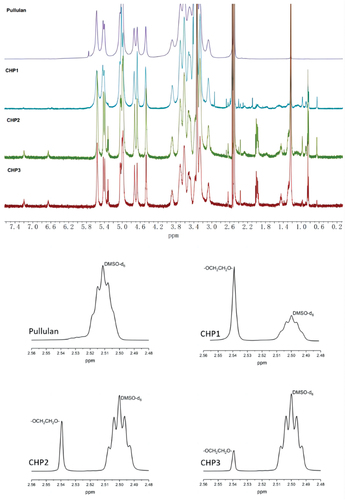
Figure 3. The sizes, zeta potentials and TEM morphology of three CHP nanoparticles.
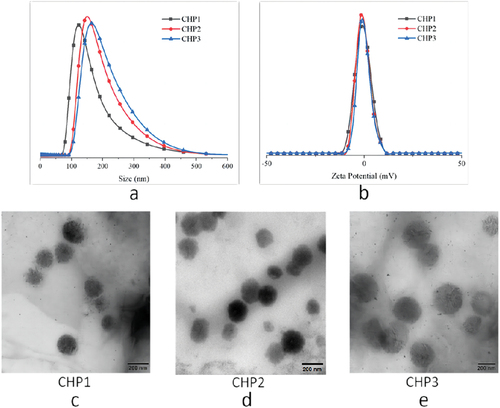
Figure 4. Particle size diagram of three feeding ratios of CHP@VCR NPs (1), CHPT@VCR NPs (3) and potential diagram of three feeding ratios of CHP@VCR NPs (2) and CHPT@VCR NPs (4).
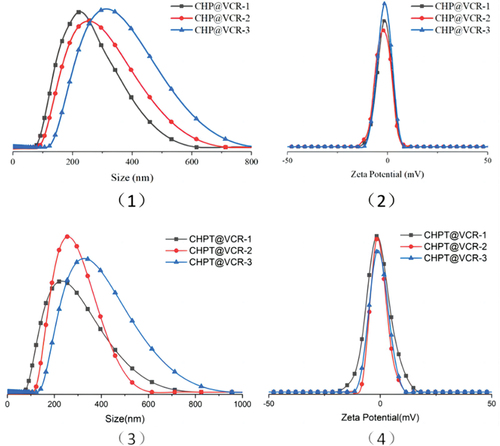
Figure 5. Capillary fluorescence scan (a); MST trajectories of three feeding ratios of CHP NPs (b); dose‒response curves of three feeding ratios of CHP NPs interacting with Tween 80 (c).
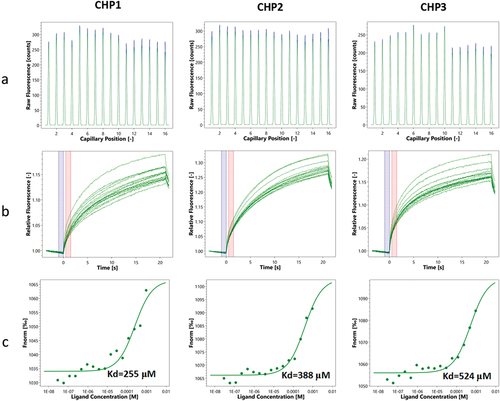
Figure 6. Drug release profiles of three drug-loaded CHPT NPs and VCR-adsorbed Tween 80 at pH 6.8 (a) and pH 7.4 (b).
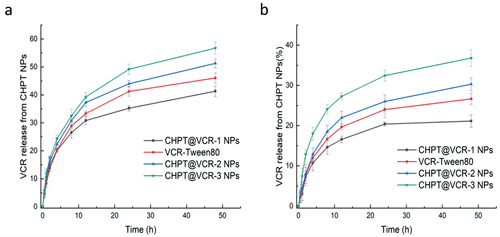
Figure 7. Cell survival rate graph of SJ-GBM2 cells under three groups of CHPT@VCR NPs and free VCR treatments (**p < 0.01, ****p < 0.0001).
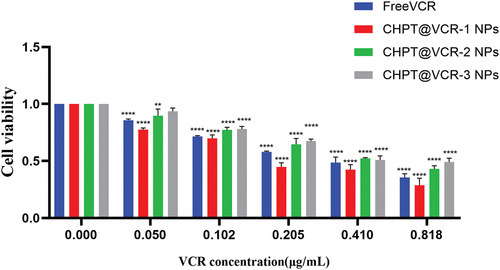
Figure 8. Uptake of FITC-labeled CHPT@VCR NPs at 2 hours in SJ-GBM2 cells, green for FITC(2 μg/mL), blue for DAPI(1 μg/mL).
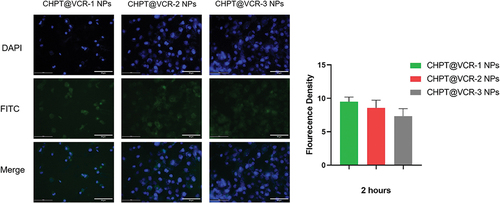
Figure 9. Cell migration diagram of three CHPT@VCR NPs (a); cell migration rate of three CHPT@VCR NPs groups (b) (**p < 0.01, ***p < 0.001 and ****p < 0.0001).
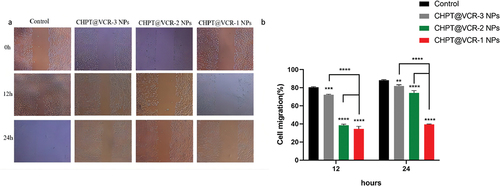
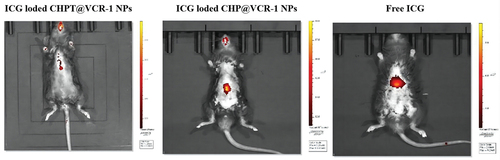
Figure 10. Fluorescence in vivo imaging in C57BL/6 mice.