
Figures & data
Figure 1. Design of the PF@MTX NP nanodelivery system and its process of exerting an anti-OS effect.
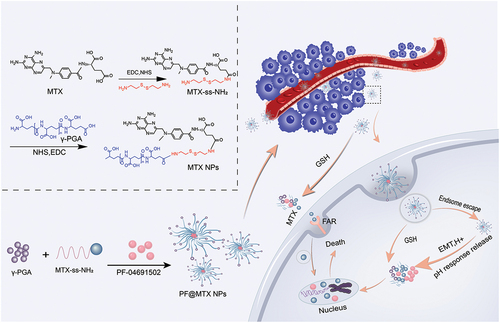
Figure 2. Toxicity of MTX (a), PF (b) and both drugs (c) in 143B cells. (d) Combination synergy score analysis using SynergyFinder 3.0. n = 3 independent experiments; *p < 0.05, **p < 0.01, ***p < 0.001 and ****p < 0.0001 represent significant differences.
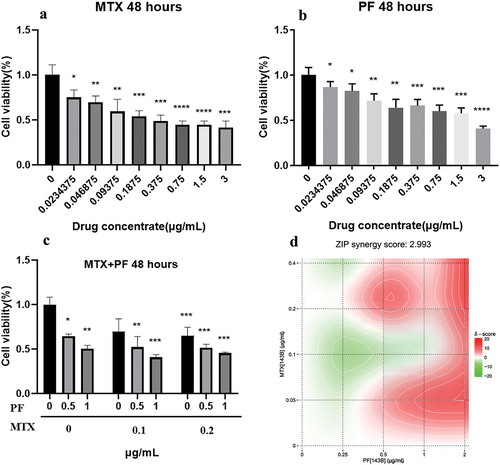
Table 1. IC50 of MTX and PF.
Figure 3. Synthesis of materials, FTIR spectra of MTX, γ-PGA, s-s, MTX-ss-NH2, MTX-ss-PGA on the left and 1 H NMR of MTX, γ-PGA, s-s, MTX-ss-NH2, MTX-ss-PGA on the right.
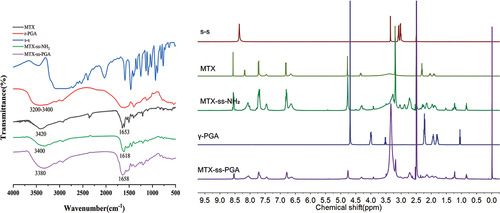
Figure 4. The particle sizes of MTX NPs (a) and PF@MTX NPs (c) and zeta potential MTX NPs (b) and PF@MTX NPs (d). TEM of MTX NPs (e) and PF@MTX NPs (f). n = 3 independent experiments.
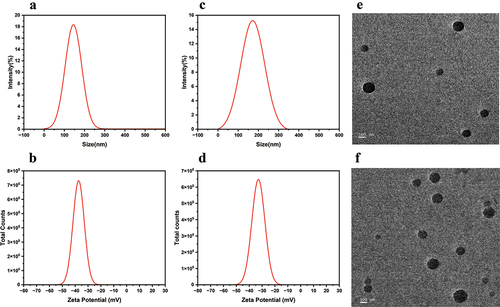
Table 2. Size and zeta of MTX NPs and PF@MTX NPs.
Figure 5. MTX (left) and PF (right) release of PF@MTX NPs in physiological conditions (pH 7.4) or simulated tumour endosomal microenvironment (pH 5.5, 10 mM GSH) during 48 hours. n = 3 independent experiments.
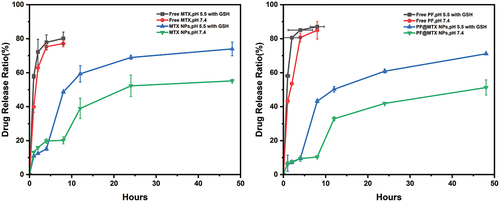
Figure 6. (a) and (d) shows the toxicity of various drugs on 143B cells; (b) shows the colony formation of 143B cells; (c) shows the colony formation rate of each group; (e)MTX NPs and PF@MTX NPs, (f) free MTX and free PF show the cytotoxicity of each group of drugs on HSF fibroblasts. n = 3 independent experiments. *p < 0.05, **p < 0.01, ***p < 0.001 and ****p < 0.0001 indicate significant differences.
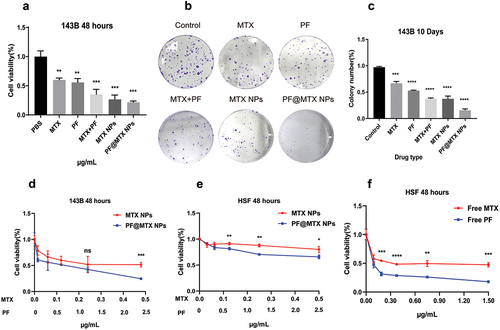
Figure 7. Cellular uptake of the nanodrug PF@MTX NPs at different times with a CY5/PF@MTX NP concentration of 10 µg/mL and DAPI concentration of 1 µg/mL. n = 3 independent experiments. *p < 0.05, **p < 0.01, ***p < 0.001 and ****p < 0.0001 represent significant differences.
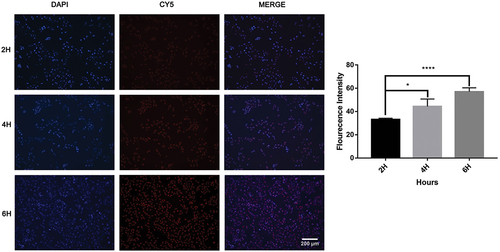
Figure 8. 143B cells scratching experiment after free MTX, free PF, dual drug combination group and MTX NPs, PF@MTX NPs treatment. n = 3 independent experiments. *p < 0.05, **p < 0.01, ***p < 0.001, ****p < 0.0001. Significantly different.
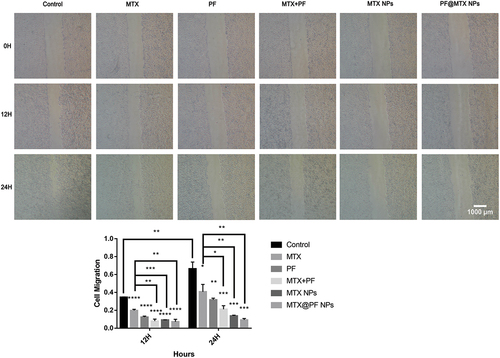
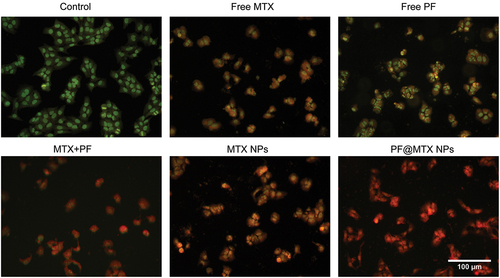
Figure 9. AO/EB fluorescence staining results. n = 3 independent experiments.
Data availability statement
The authors declare that all data supporting the findings of this study are available within the paper.