Figures & data
Figure 1. (a) Pain diagram at time of initial evaluation displaying severe back and leg pain pre-stent; (b) post-stent pain diagram with symptoms alleviation.
Figure 2. (a) Pre-stent angiogram showing 75% right common iliac artery occlusion; (b) post-stent angiogram associated with immediate relieve of back and leg pain.
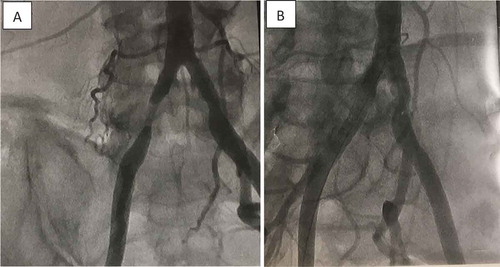
Table 1. Examination findings associated with neurogenic and vascular claudication.
Figure 3. Clinical decision-making for differential diagnosis of neurogenic versus vascular claudication for patients with complaints of lower extremity pain and risk factors for peripheral vascular disease (ABI = Ankle-Brachial Index).