Figures & data
FIGURE 1 Different parameterizations for the nondimensional counter-gradient.
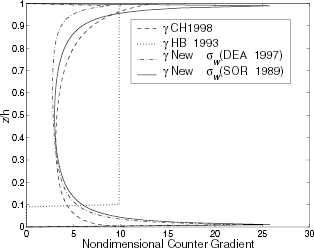
FIGURE 2 New counter-gradient estimation by second-order maximum entropy with given in [Citation18]: (a) noise 1%, with λ = 2.5×10¹⁰; (b) noise 2.5%, with λ = 4.5× 10¹⁰; and (c) noise 5%, with λ = 4.0×10¹⁰.
![FIGURE 2 New counter-gradient estimation by second-order maximum entropy with given in [Citation18]: (a) noise 1%, with λ = 2.5×10¹⁰; (b) noise 2.5%, with λ = 4.5× 10¹⁰; and (c) noise 5%, with λ = 4.0×10¹⁰.](/cms/asset/8b7fb99e-808c-4f67-9b77-1cc18e23463a/gipe_a_10054081_o_f2.gif)
FIGURE 3 Influence of the regularization parameter to 1% of noise: (a) without regularization; (b) λ = 1.0 × 10⁷ (c) λ = 2.5 × 10¹⁰; (d) λ = 1.29 × 10¹¹.
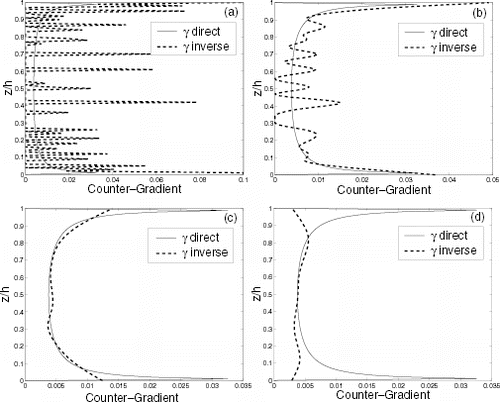
FIGURE 4 L-curve for reconstruction of counter-gradient with 1% of noise.
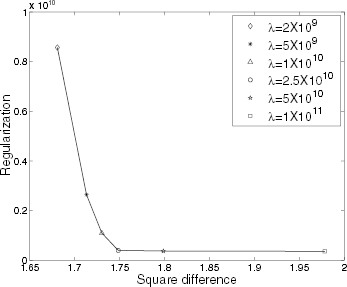
FIGURE 5 Concentration profiles at three times t = 0 s, t = 400 s and t = 2000 s: the solid line represents the diffusion without counter-gradient term, the dashed line represents the use of counter-gradient term given by Eqs. (Equation2), (Equation4) and (EquationA.3).
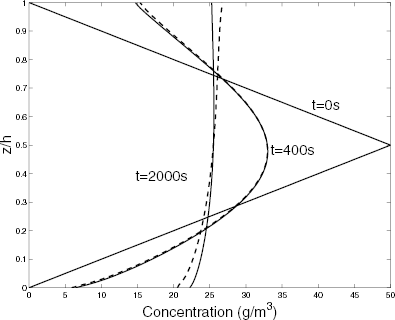
FIGURE 6 Concentration profiles for three time periods: the solid line with counter-gradient term given by Eqs. (Equation2), (Equation4) and (EquationA.3); the dashed line the counter-gradient is given in [Citation4] (Eqs. (Equation2), (Equation3) and (EquationA.2)).
![FIGURE 6 Concentration profiles for three time periods: the solid line with counter-gradient term given by Eqs. (Equation2), (Equation4) and (EquationA.3); the dashed line the counter-gradient is given in [Citation4] (Eqs. (Equation2), (Equation3) and (EquationA.2)).](/cms/asset/d6bad564-dd33-4802-a51d-b46ae4de167d/gipe_a_10054081_o_f6.gif)
TABLE I Difference between several formulations for the counter-gradient term
TABLE II Square error between exact and estimated counter-gradient terms for several levels of noise
Table