20,988
Views
4
CrossRef citations to date
0
Altmetric
Articles

The neural basis of reactive aggression and its development in adolescence

& ORCID Icon
Pages 313-333 | Received 15 Nov 2017, Accepted 18 Dec 2017, Published online: 05 Jan 2018

Figures & data

Figure 1. I3 Model of aggression: Proclivity to aggress (y-axis) is determined by the net strength of the interaction between Instigating (x-axis) and Impellence factors. Aggressive behaviour only manifests when the strength of proclivity to aggress exceeds the strength of Inhibition factors, shown here as the behaviour thresholds. Taken from Finkel and Hall (Citation2018). Reprinted from Current Opinion in Psychology, 19, Finkel & Hall, The I3 Model: a metatheoretical framework for understanding aggression, 125-130, Copyright (2018), with permission from Elsevier.
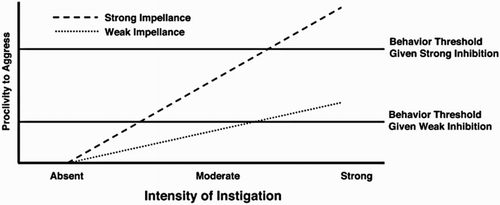
Figure 1. I3 Model of aggression: Proclivity to aggress (y-axis) is determined by the net strength of the interaction between Instigating (x-axis) and Impellence factors. Aggressive behaviour only manifests when the strength of proclivity to aggress exceeds the strength of Inhibition factors, shown here as the behaviour thresholds. Taken from Finkel and Hall (Citation2018). Reprinted from Current Opinion in Psychology, 19, Finkel & Hall, The I3 Model: a metatheoretical framework for understanding aggression, 125-130, Copyright (2018), with permission from Elsevier.