
Figures & data
Figure 1. Frequency distributions for information disclosure in each interview phase, by interview condition.
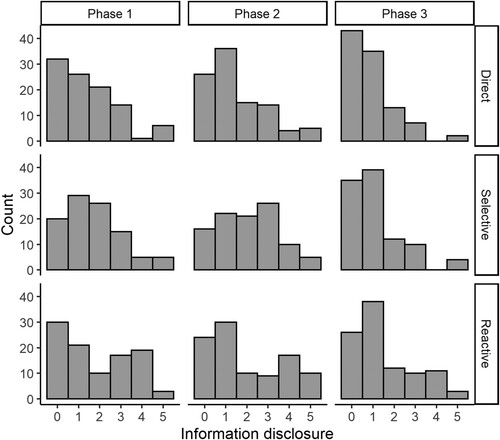
Table 1. Descriptive statistics for information disclosure in each interview phase, by interview condition.
Table 2. Linear mixed model predicting information disclosure.
Figure 2. Trajectories of information disclosure across the three interview phases, by interview strategy. Information disclosure (0–5) is plotted on the vertical axis. Each panel represents an interview condition. Within each panel, the phases of the interview are plotted on the horizontal axis. The bold line tracks the group mean information disclosure at each phase (with a 95% confidence interval). The semi-transparent grey lines plot the trajectory of each individual participant in each condition, jittered slightly horizontally and vertically to more easily distinguish between lines.
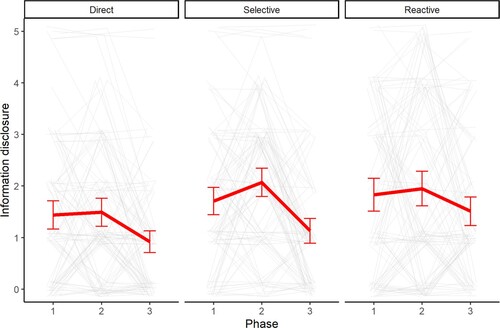
Figure 3. Frequency distributions of self-assessment of performance, interview quality, and interviewer perception.
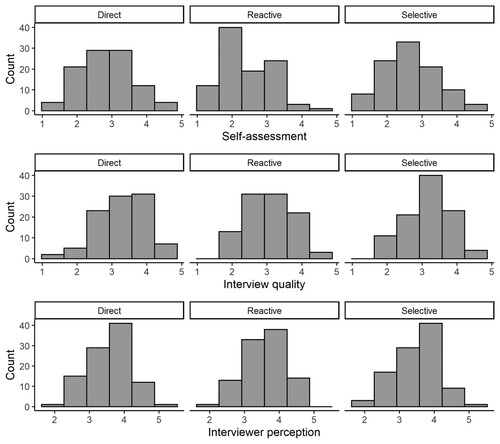
Table 3. Descriptive statistics for self-assessment, interview quality, and interviewer perception with comparisons to specific scale points.
Table 4. Comparisons of each condition for self-assessment, interview quality, and interviewer perception.