
Figures & data
Table 1. Prevalence rates and group characteristics.
Figure 1. Annual incident disciplinary events rate (excluding violence and self-harm) by group.
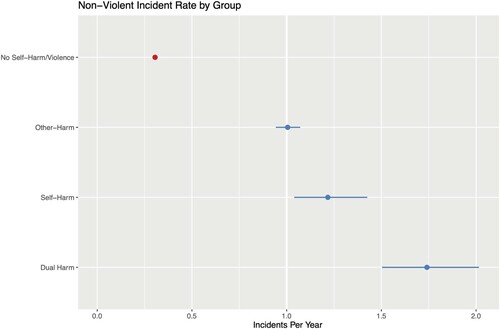
Table 2. Rate ratios for pairwise comparisons in annual incident rate between groups (with p adjusted for multiple comparisons).
Table 3. Odds ratios and 95% CIs for the differences for each of the 11 disciplinary categories.
Table 4. Education and health history.
Table 5. Post-hoc contrasts and Hochberg adjusted significance levels (continuous variables).
Table 6. Adjusted Standardised Residuals and Hochberg adjusted significance level (categorical variables).