


Figures & data
Table 1. The frequency of participants per age group and gender.
Figure 1. Illustration of the experimental setup.
Note. Panel A: A target presented wearing a hoodie and sunglasses at 5 meters in 300 lux (i.e. optimal lighting). Panel B: A target presented wearing a hoodie and sunglasses at 12.5 meters in 300 lux. Panel C: A target presented wearing a hoodie and sunglasses at 20 meters in 300 lux.
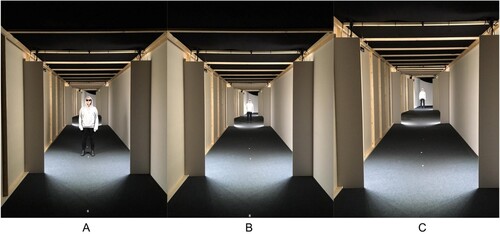
Table 2. All participants: The frequencies of correct or incorrect line-up choices and the calculated diagnostic values per lighting level, facial masking, distance, line-up type.
Table 3. Young adults (18–44): The frequencies of correct or incorrect line-up choices and the calculated diagnostic values per lighting level, facial masking, distance, line-up type.
Table 4. Older adults (45–99): The frequencies of correct or incorrect line-up choices and the calculated diagnostic values per lighting level, facial masking, distance, line-up type.
Table 5. Young children (5–11): The frequencies of correct or incorrect line-up choices and the calculated diagnostic values per lighting level, facial masking, distance, line-up type.
Table 6. Older children (12–17): The frequencies of correct or incorrect line-up choices and the calculated diagnostic values per lighting level, facial masking, distance, line-up type.
Table 7. Confidence per lighting, facial masking, distance, and age group.
Table 8. Response time per lighting, facial masking, distance, and age group.
Figure 2. Identification accuracy in TP line-ups with no facial masking in optimal and suboptimal lighting (only choosers).
Note. The predicted probabilities of identification accuracy in target present line-ups (only the choosers) by distance, lighting, and age group with no facial masking. Here, the sample had been reduced to only the choosers (i.e. all decisions that were rejections had been removed). On the left, optimal lighting. On the right, suboptimal lighting. TP = Target present line-up, Optimal lighting = 300 lux, Suboptimal lighting = 2 lux. Young adults = 18–44, Older adults = 45–90, Young children 5–11, Older children 12–17. All results are based on multilevel binary logistic regressions. The line-ups consisted of eight images that were presented simultaneously; meaning that chance level of identifying the actual target was at .125.
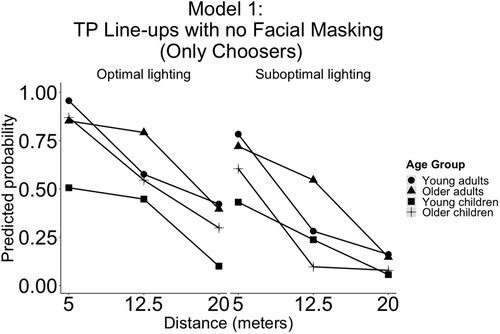
Figure 3. Rejection accuracy in TA line-ups with no facial masking in optimal and suboptimal lighting (choosers & non-choosers).
Note. The predicted probabilities of rejection accuracy in target absent line-ups (choosers and non-choosers) by distance, lighting, and age group with no facial masking. On the left, optimal lighting. On the right, suboptimal lighting. TA = Target absent line-up, Optimal lighting = 300 lux, Suboptimal lighting = 2 lux. Young adults = 18–44, Older adults = 45–90, Young children 5–11, Older children 12–17. All results are based on multilevel binary logistic regressions. The line-ups consisted of eight images that were presented simultaneously.
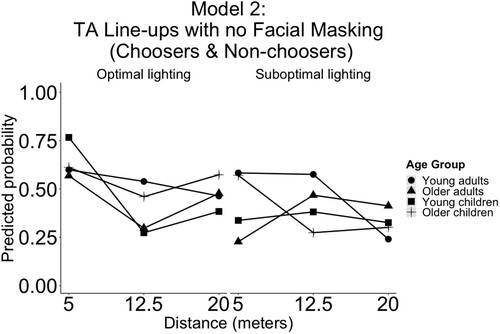
Figure 4. Identification accuracy in TP line-ups with facial masking in optimal and suboptimal lighting (only choosers).
Note. Panel A: The predicted probabilities of identification accuracy in target present line-ups by distance and facial masking in optimal lighting. Panel B: The same as Panel A but in suboptimal lighting. Here, the sample had been reduced to only the choosers (i.e. all decisions that were rejections had been removed). TP = Target present line-up, Optimal lighting = 300 lux, Suboptimal lighting = 2 lux. Young adults = 18–44, Older adults = 45–90, Young children 5–11, Older children 12–17. All results are based on multilevel binary logistic regressions. The line-ups consisted of eight images that were presented simultaneously; meaning that chance level of identifying the actual target was at .125.
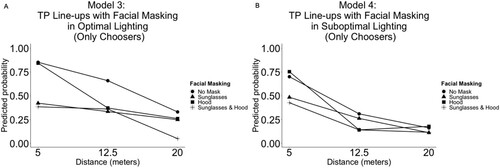
Figure 5. Rejection accuracy in TA line-ups with facial masking in optimal and suboptimal lighting (choosers & non-choosers).
Note. Panel A: The predicted probabilities of rejection accuracy in target absent line-ups (choosers and non-choosers) by distance and facial masking in optimal lighting. Panel B: The same as Panel A but in suboptimal lighting. TA = Target absent line-up, Optimal lighting = 300 lux, Suboptimal lighting = 2 lux. Not separated by age group because there was no main effect of age. Age groups = Young adults = 18–44, Older adults = 45–90, Young children 5–11, Older children 12–17. All results are based on multilevel binary logistic regressions. The line-ups consisted of eight images that were presented simultaneously.
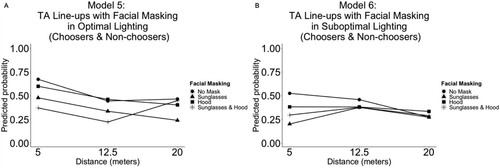
Figure 6. Confidence-accuracy characteristic analyses per lighting, facial masking, distance, and confidence bin.
Note. Panels A-H: Confidence-Accuracy Characteristic Analyses per Lighting, Facial Masking, Distance, and Confidence Bin. The total sample includes 4456 line-up decisions. However, there were 207 missing confidence judgements in the sample (i.e. participants that forgot or due to errors did not report their confidence). The figure above contains information based on 4249 decisions (4456–207). Please see Table 9 for the raw values that the CAC analyses are based on. Age range: 5–90. Optimal = 300 lux, Suboptimal = 2 lux, no mask = No disguise worn by live target, sunglasses, hood, sunglasses & hood = descriptions of the disguise worn by the live target. CAC = Confidence-accuracy characteristic, Confidence = post line-up decision. Distance was measured in meters (m). The formula used to calculate the CAC value per bin (0–59%, 60–89%, 90–100%) was: target present (TP) identifications / (TP filler identifications + (target absent (TA) filler identification)/8). In other words, we assumed fair line-ups and that is why we divided by eight (i.e. the number of images in the line-ups).
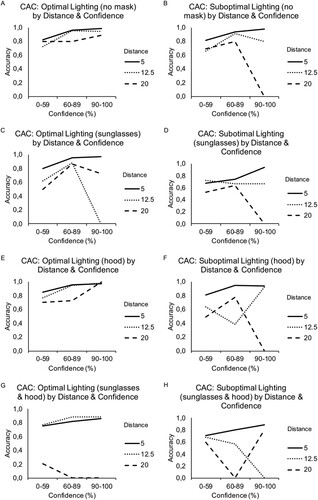
Table 9. Confidence-accuracy characteristic analyses per lighting, facial masking, distance, line-up type, decisions, and confidence bin.
Figure 7. Raw data receiver operating characteristic (ROC) curves per lighting.
Note. Receiver Operating Characteristic (ROC) Curves per lighting condition. Optimal Lighting = 300 lux, Suboptimal Lighting = 2 lux. This analysis was based on 4249 observations (4456 observations minus 207 missing confidence judgements).
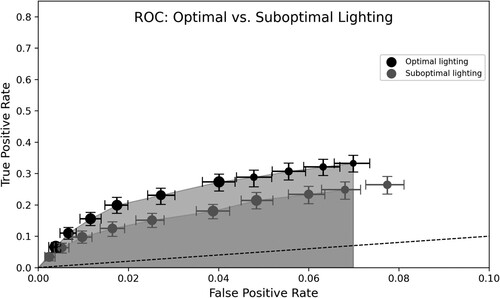
Figure 8. Raw data receiver operating characteristic (ROC) curves per lighting, facial masking, and distance.
Note. Panel A: Receiver Operating Characteristic (ROC) curves per distance (5 meters (m), 12.5, 20 m) in optimal lighting (300 lux). This analysis was based on 2197 observations (2283 observations minus 86 missing confidence judgements). Panel B: ROC curves per distance in suboptimal lighting (2 lux). This analysis was based on 2052 observations (2173 observations minus 121 missing confidence judgements). Panel C: ROC curves per facial masking in optimal lighting (no_mask = no facial masking worn by live target; sunglasses = facial masking (sunglasses) worn by live target, hood = facial masking (hood) worn by live target, sunglasses_&_hood = facial masking (sunglasses and hood) worn by live target). This analysis was based on 2197 observations (2283 observations minus 86 missing confidence judgments). Panel D: ROC curves per facial masking in suboptimal lighting. This analysis was based on 2052 observations (2173 observations minus 121 missing confidence judgements).
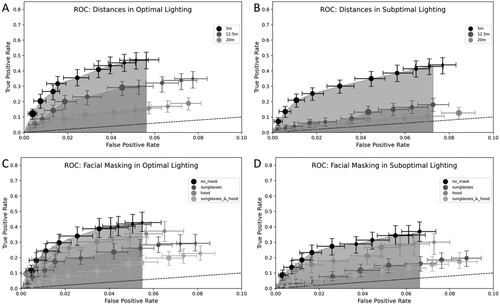
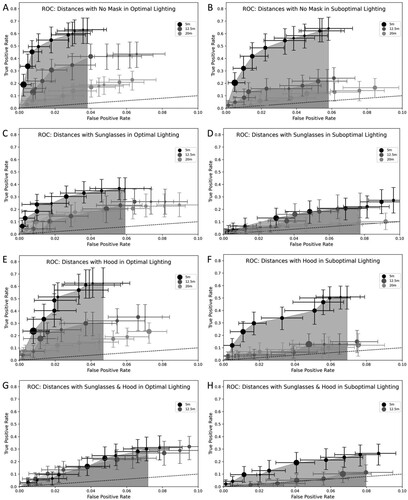
Figure 9. Raw data receiver operating characteristic (ROC) curves per lighting, facial masking, and distance.
Note. Panel A: Receiver Operating Characteristic (ROC) curves per distance (5 meters (m), 12.5, 20 m) in optimal lighting (300 lux) with no facial masking worn by target. This analysis was based on 586 observations (609 observations minus 23 missing confidence judgements). Panel B: ROC curves per distance in suboptimal lighting (2 lux) with no facial masking worn by target. This analysis was based on 541 observations (574 observations minus 33 missing confidence judgements). Panel C: ROC curves per distance in optimal lighting with sunglasses worn as facial masking by target. This analysis was based on 571 observations (595 observations minus 24 missing confidence judgements). Panel D: ROC curves per distance in suboptimal lighting with sunglasses worn as facial masking by target. This analysis was based on 522 observations (551 observations minus 29 missing confidence judgements). Panel E: ROC curves per distance in optimal lighting with a hood worn as facial masking by target. This analysis was based on 525 observations (549 observations minus 24 missing confidence judgements). Panel F: ROC curves per distance in suboptimal lighting with hood worn as facial masking by target. This analysis was based on 543 observations (573 observations minus 30 missing confidence judgements). Panel G: ROC curves per distance in suboptimal lighting with sunglasses and a hood worn as facial masking by target. This analysis was based on 515 observations (530 observations minus 15 missing confidence judgements). Panel H: ROC curves per distance in suboptimal lighting with sunglasses and a hood worn as facial masking by target. This analysis was based on 446 observations (475 observations minus 29 missing confidence judgements). Due to the lack of target identifications, we were unable to create ROC curves for 20 m for the figures in Panels G and H.
Supplemental Material
Download MS Word (683.1 KB)Data availability statement
The datasets analyzed for this study can be found in the Open Science Framework: https://osf.io/s5tcu/; https://osf.io/s5tcu/?view_only=0c6f9455d2434110a6c33b230ffc5377