
Figures & data
Table 1. Proportions and frequencies (n) of target present and absent identification decisions as a function of appearance, procedure, and position.
Table 2. Mean (SD) post-decisional confidence in target present and absent identification decisions as a function of appearance, procedure, and position.
Table 3. Multi-d’ as a function of appearance, procedure, and position.
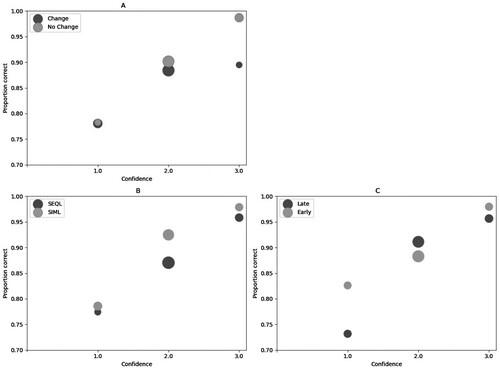
Figure 1. Confidence accuracy characteristic curves (generated using the Python toolkit, Pywitness; Mickes et al., Citation2022) for appearance (A), procedure (B) and position (C). Note the CAC curves do not have error bars because too few incorrect replacement IDs were made at all levels of confidence to compute stable bootstrap estimates. On the x-axis, numbers 1.0, 2.0, and 3.0 denote, low, medium and high confidence, respectively.
Supplemental Material
Download MS Word (236.3 KB)Data availability statement
The data that support the findings of this study are openly available in The Open Science Framework (OSF) at https://doi.org/10.17605/OSF.IO/4XR6Z.
