
Figures & data
Table 1. List of cues included in the survey.
Table 2. Explanatory mechanisms of deception cues included in the survey.
Figure 1. Example question on cues and moderators.
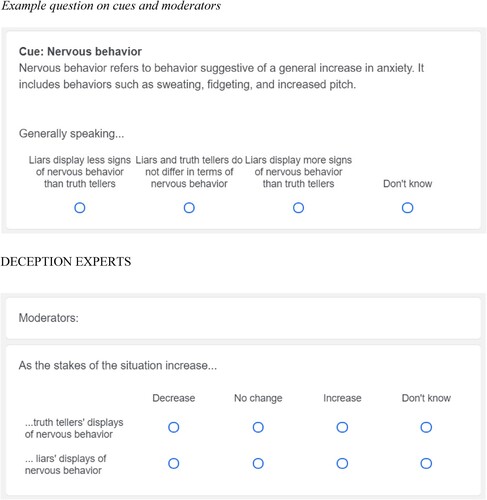
Figure 2. Expert beliefs about deception cues.
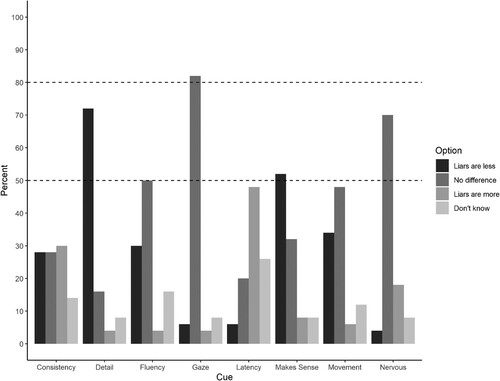
Table 3. Additional cues mentioned by respondents not included in the survey
Figure 3. Beliefs about moderators of deception cues.
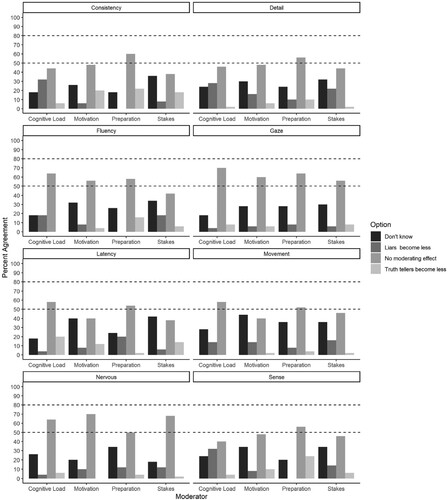
Table 4. Additional moderators mentioned by respondents not included in the survey.
Figure 4. Beliefs about explanatory mechanisms of deception cues. Note: Height of the colors on each bar represents the proportions of each response.
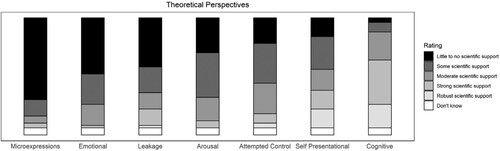
Table A1. Frequency counts of expert opinions about cues to deception.
Table A2. Frequency counts of expert opinions about deception cue moderators.
Table A3. Frequency counts of expert opinions about deception cue theories.
