
Figures & data
Figure 1. Plot of the linear mixed model results for OGP scores. Analysis included a total of n = 19,440 individuals, with data from 3 years before to 3 years after referral to the Pathway.
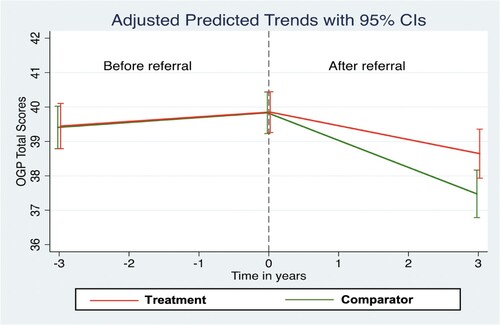
Table 1. Propensity weighted linear mixed model results for OGP scores. Analysis included a total of n = 19,440 individuals, with data from 3 years before to 3 years after referral to the Pathway.
Figure 2. Plot of the linear mixed model results for OVP scores. Analysis included a total of n = 19,440 individuals, with data from 3 years before to 3 years after referral to the Pathway.
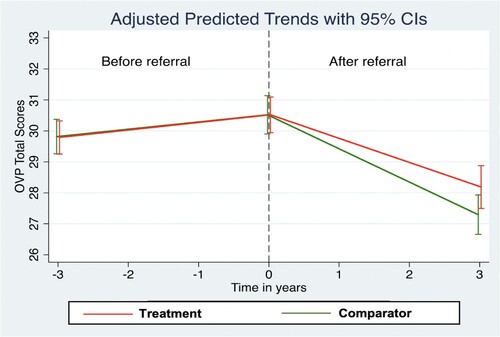
Table 2. Propensity weighted linear mixed model results for OVP scores. Analysis included a total of n = 19,440 individuals, with data from 3 years before to 3 years after referral to the Pathway.
Table 3. Propensity weighted negative binomial regression for adjudication incidence counts. Analysis included a total of n = 12,998 individuals, with data from 3 years before to 3 years after referral to the Pathway.
Table 4. Propensity weighted Poisson regression for number of recalls. Analysis included a total of n = 6440 individuals, with data from 3 years before to 3 years after referral to the Pathway.
Figure 3. Plot of incidence rates from propensity weighted negative binomial model for number of self-harm reports. Analysis included a total of n = 5513 individuals, with data from 3 years before to 3 years after referral to the Pathway
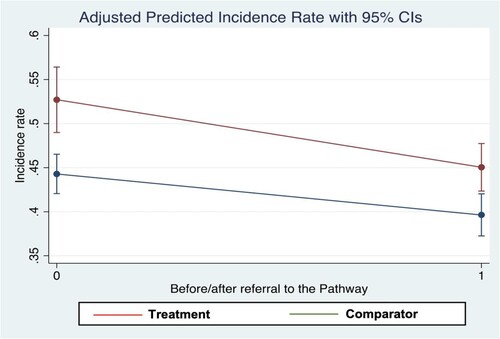
Table 5. Propensity weighted negative binomial regression for number of self-harm reports. Analysis included a total of n = 5513 individuals, with data from 3 years before referral to 3 years after referral to the Pathway.
Figure 4. Plot of incidence rates from propensity weighted negative binomial model for number of non-violent offences. Analysis included a total of n = 402 individuals, with data from 2 years before referral to 2 years after referral to the Pathway
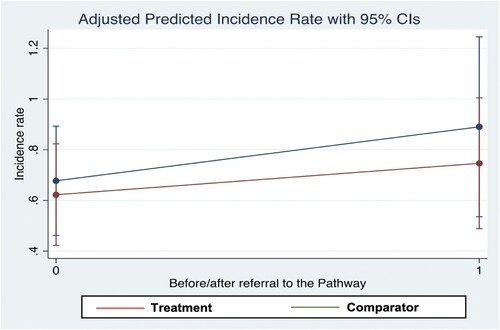
Table 6. Propensity weighted negative binomial regression for number of non-violent offences. Analysis included a total of n = 402 individuals, with data from 2 years before to 2 years after referral to the Pathway.
Figure 5. Plot of incidence rates from propensity weighted negative binomial model for number of sexual offences. Analysis included a total of n = 1359 individuals, with data from 2 years before to 2 years after referral to the Pathway
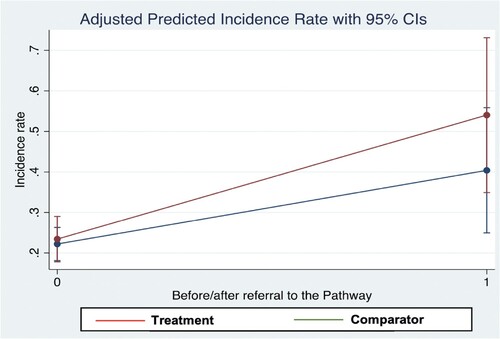
Table 7. Propensity weighted negative binomial regression for number of sexual offences. Analysis included a total of n = 1359 individuals, with data from 2 years before to 2 years after referral to the Pathway.
Figure 6. Plot of incidence rates from propensity weighted negative binomial model for number of violent offences. Analysis included a total of n = 10,977 individuals, with data from 2 years before to 2 years after referral to the Pathway
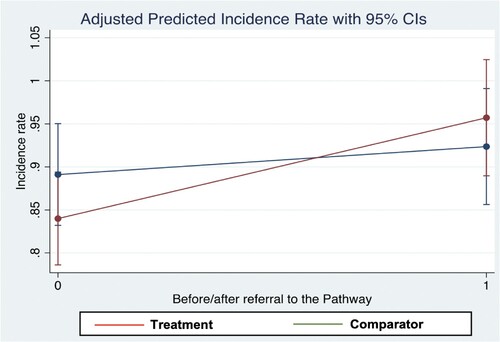
Table 8. Propensity weighted negative binomial regression for number of violent offences. Analysis included a total of n = 10,977 individuals, with data from 2 years before to 2 years after referral to the Pathway.
Figure 7. Plot of incidence rates from propensity weighted negative binomial model for number of sexual and violent offences. Analysis included a total of n = 3468 individuals, with data from 2 years before to 2 years after referral to the Pathway.
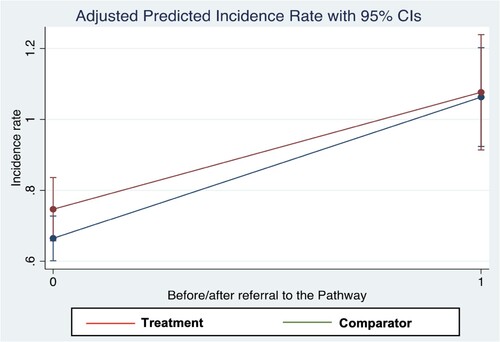
Table 9. Propensity weighted negative binomial regression for number of sexual and violent offences. Analysis included a total of n = 3478 individuals, with data from 2 years before to 2 years after referral to the Pathway.
Supplemental Material
Download MS Word (119.1 KB)Data availability statement
The use of Ministry of Justice data was addressed by a time limited Data Sharing Agreement between the Ministry of Justice and Kings College London. Due to the sensitive nature of the research (high risk, high harm offending data), and due to legal restrictions, supporting data are not available.