
Figures & data
Table 1. Demographic Information, Sample Characteristics, and Psychometric Test Scores for Participants.
Table 2. Comparison of Mean Number of Previous Orders.
Table 3. Odds Ratios for Effects for Logistic Regression Model Examining Violent Index Offence.
Table 4. Wald statistics for Logistic Regression Model Interaction Terms examining Violent Index Offence.
Table 5. Incidence Rate Ratios for Previous Number of Orders.
Figure 1. The Interaction Between Externalising Symptoms and Child Protection Status on Number of Previous Orders.
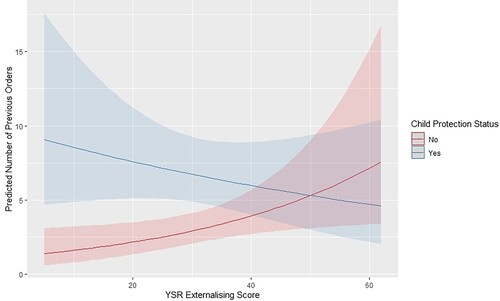
Figure 2. The Interaction Between Ethnocultural Group and Child Protection Status on Number of Previous Orders.
Note. ESB = English Speaking Background; CALD = Culturally and Linguistically Diverse.
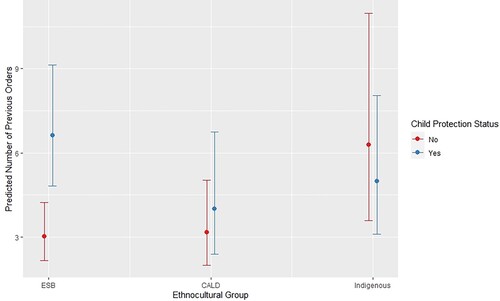
Table 6. Incidence Rate Ratios for Variable Interactions and Previous Number of Orders.
Table 7. Incidence Rate Ratios for Variable Interactions and Previous Number of Orders.
Data availability
The data is publicly unavailable due to ethical restrictions. Please contact the lead researcher for further information.
