

Figures & data
Table 1. Short-term symptoms experienced by healthy adults following alcohol consumption.
Figure 1. Most reported terms by intoxication level with associated language category codes.
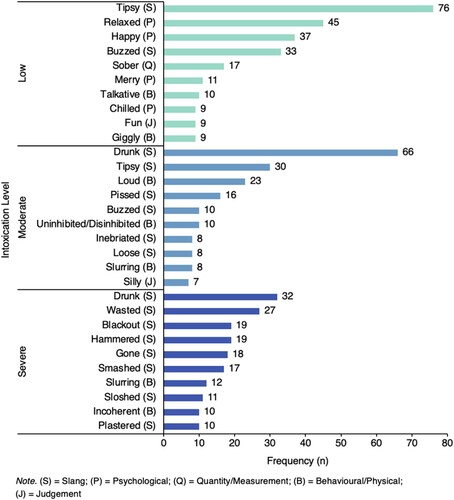
Figure 2. Percentage of intoxication term categories by intoxication level.
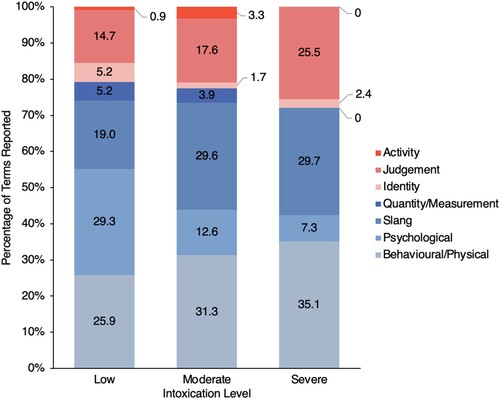
Figure 3. Standard drink definitions by intoxication level and gender.
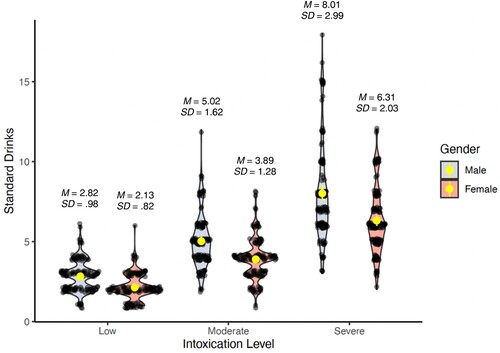
Figure 4. BAC definitions by intoxication level.
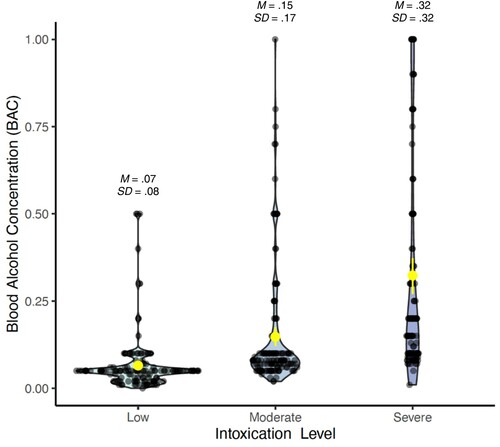
Figure 5. Most selected symptoms by intoxication level.
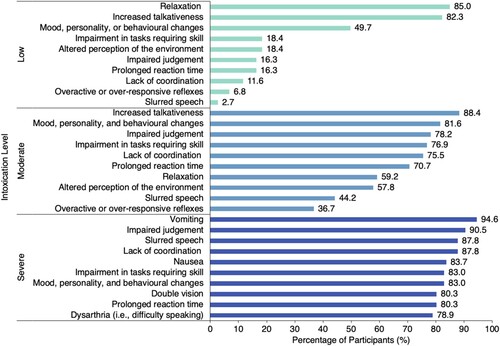
Table 2. Linear regressions: The impact of individual differences on intoxication definitions using standard drinks assigned to a male target.
Table 3. Linear regressions: The impact of individual differences on intoxication definitions using standard drinks assigned to a female target.
Table 4. Linear regressions: The impact of individual differences on intoxication definitions using BAC.
Table 5. Ordinal logistic regression: The impact of individual differences on perceived thresholds for alcohol-induced memory impairment in terms of intoxication levels.
Table 6. Linear regression: The impact of individual differences on the perceived threshold for alcohol-induced memory impairment in terms of standard drinks.
Table 7. Linear regression: The impact of individual differences on the perceived threshold for alcohol-induced memory impairment in terms of BAC.
Table 8. Ordinal logistic regression: The impact of individual differences on the perceived threshold for alcohol-impaired capacity for sexual consent in terms of intoxication levels.
Table 9. Linear regression: The impact of individual differences on the perceived threshold for alcohol-impaired capacity for sexual consent in terms of standard drinks.
Table 10. Linear regression: The impact of individual differences on the perceived threshold for alcohol-impaired capacity for sexual consent in terms of BAC.
Table 11. Forms of intoxication evidence ordered by perceived usefulness.
Data availability statement
The data that support the findings of this study are available from the corresponding author upon reasonable request.
