
Figures & data
Table 1. Trope and Liberman’s (Citation2010) construal level theory of psychological distance.
Figure 1. Theoretical model of psychological distance and worry about crime. Note. +/− denotes hypothesised direction of relationships among latent variables.
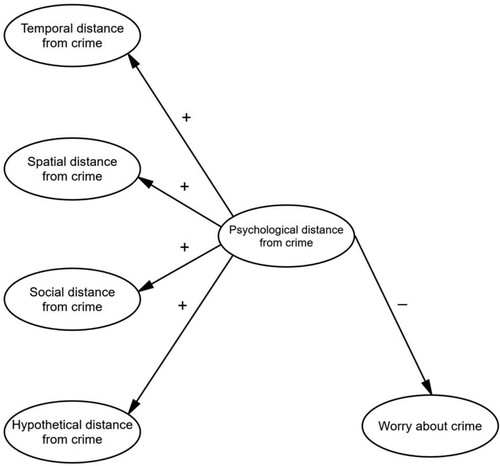
Table 2. Demographic characteristics for participants (N = 719).
Figure 2. Hypothesised measurement model of psychological distance from crime.
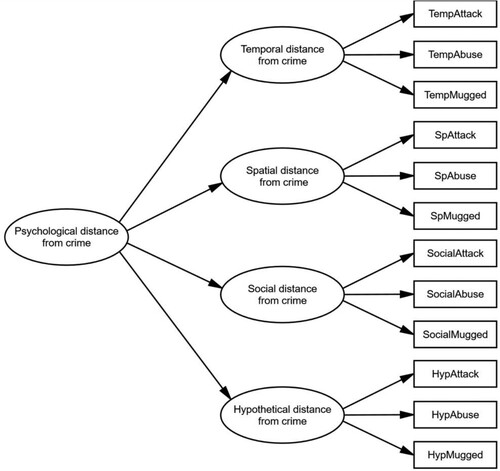
Figure 3. Hypothesised structural regression model of psychological distance from crime and worry about crime.
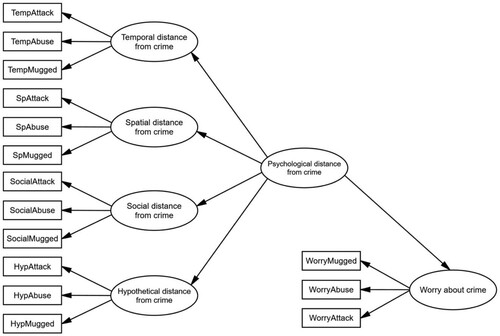
Figure 4. CFA results. Note. *** Denotes statistically significant result (p < .001). AVEPsychological distance = .65; AVETemporal distance = .61; AVESpatial distance = .62; AVESocial distance = .60 AVEHypothetical distance = .61.
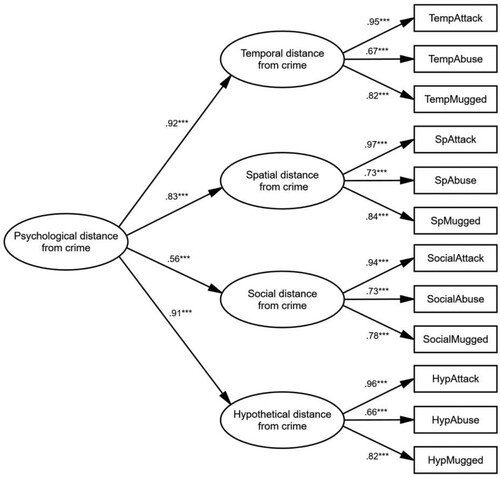
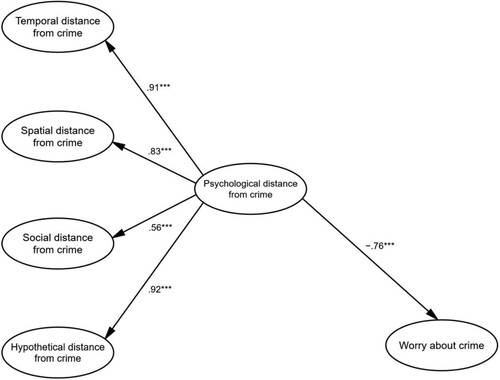
Figure 5. Structural Regression Results. Note. Measurement model not shown. *** Denotes statistically significant result (p < .001).
Supplemental Material
Download MS Word (31.8 KB)Data availability statement
Due to the nature of this research, participants of this study did not agree for their data to be shared publicly, so supporting data is not available.